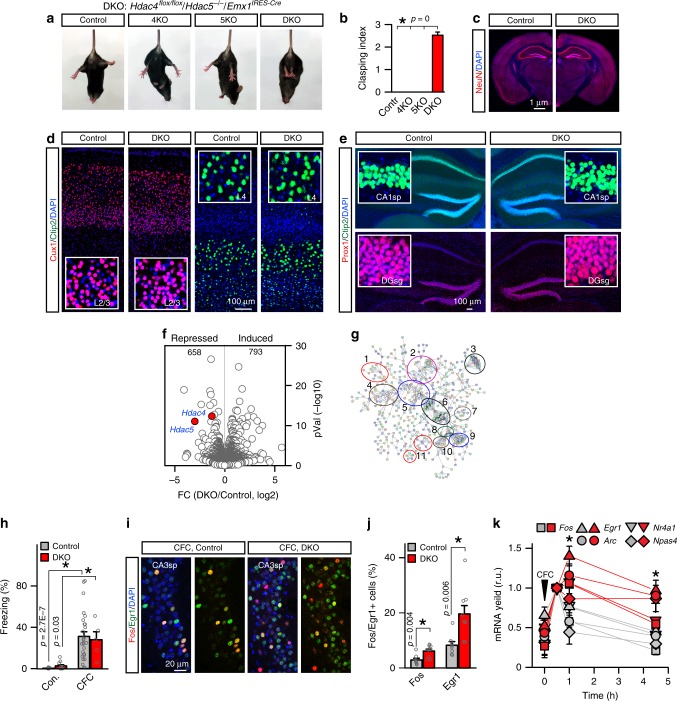
Fig. 2.
Characterization of HDAC4/5-deficient mice. a Photographs of p60 control, conditional Hdac4 knockout (KO, Hdac4flox/flox/Emx1IRES-Cre), constitutive Hdac5 KO (Hdac5−/−), and Hdac4/5 double knockout (DKO, Hdac4flox/flox/Hdac5−/−/Emx1IRES-Cre) mice subjected to tail suspension test. b Averaged leg clasping indexes. n = 20 mice/genotype. c Gross brain anatomies of p60 control and DKO mice. Coronal brain sections were stained with DAPI and the antibody to a pan-neuronal marker, NeuN. See also Supplementary Fig. 5. d, e, Sections were labeled with antibodies against layer/subtype-specific markers of excitatory neurons, Cux1, Ctip2, and Prox1. Images of the primary somatosensory cortex (d) and the hippocampus (e) are shown. Higher-magnification frames are displayed in inserts. f, g RNA-seq analysis of gene expression in the hippocampus at p60. Volcano plot (f) and the STRING network of differentially expressed transcripts (g) are shown (n = 3 mice/genotype). The following clusters are marked: (1) neurotransmitter receptors and calcium channels; (2) cytoskeleton and scaffolds; (3) protein turnover; (4) membrane trafficking; (5) calcium signaling; (6) G proteins and G protein-coupled receptors; (7) MAP kinases; (8) adenylate cyclases; (9) dopamine and hormone receptors; (10) phosphodiesterases. See also Supplementary Fig. 6 and Data Files 2 and 3. h–k Expression of ERGs in the hippocampus during associative learning. h Analysis of short-term memory performance, assessed by measuring freezing in the same context 1.5 h post CFC. Control/Control, n = 11; Control/CFC, n = 27; DKO/Control, n = 11; DKO/CFC, n = 5. i Images of CA3sp of fear-conditioned control and DKO mice (1.5 h post CFC). Sections were labeled with DAPI and antibodies against Fos and Egr1. j Quantifications of Fos/Egr1-positive cells in CA3sp. n = 3 mice/genotype. k Transcripts were isolated from hippocampi at indicated time points after CFC and expression levels of various ERGs were measured by qPCR. Values from four to five mice per genotype/time point are normalized to 30 min post CFC to highlight the prolonged window of ERG expression in DKOs. *p < 0.05 (t-test). The color coding is the same as in j. All quantifications are represented as Mean ± SEM (error bars). *p < 0.05 (defined by ANOVA and/or t-test)

