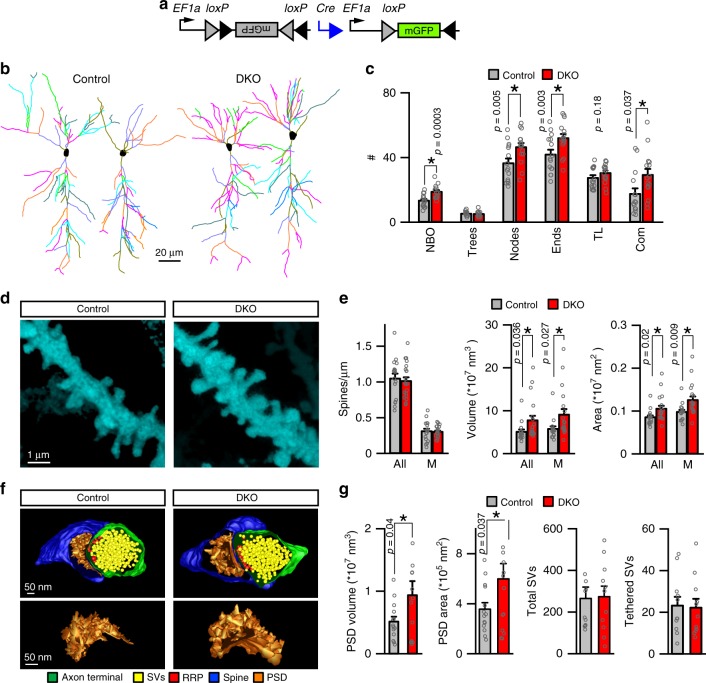
Fig. 4.
Morphologies of dendrites and synapses of HDAC4/5-deficient excitatory neurons. a–e Pyramidal cells in the CA1 of DKO and control Emx1IRES-Cre mice were visualized by Cre-inducible expression of membrane-bound GFP from an adeno-associated virus (AAV DJ DIO-mGFP). Animals were injected with AAVs at p45 and analyzed by confocal imaging of brain sections at p60. a Schematic diagram of AAV recombination. b 3D reconstructions of dendritic trees of individual glutamatergic neurons. c Quantifications of branch orders (NBO), trees, nodes, ends, tree length (TL, μm × 100), and complexity indexes (Com, a.u. × 10,000). Averaged values are from 3 mice/15 neurons per genotype. d Pseudo-colored images of postsynaptic spines on proximal dendrites in CA1sr. e Linear densities, surface areas, and volumes of all and mushroom (M)-type spines. Control: n = 3 mice/17 neurons; DKO: n = 3/21. f, g EM tomography analysis of architectures of glutamatergic synapses in CA1sr. f Top panels: 3D reconstructions of spines, postsynaptic densities (PSDs), nerve terminals, and synaptic vesicles (SVs). Bottom panels: isolated 3D reconstructions of PSDs. g Average volumes and surface areas of PSDs, total SV pools, and numbers of vesicles tethered to active zones (RRP). Control: n = 3 mice/14 synapses; DKO: n = 3/14. All quantifications are represented as Mean ± SEM. *p < 0.05 (defined by t-test). Actual p-values are indicated in each graph

