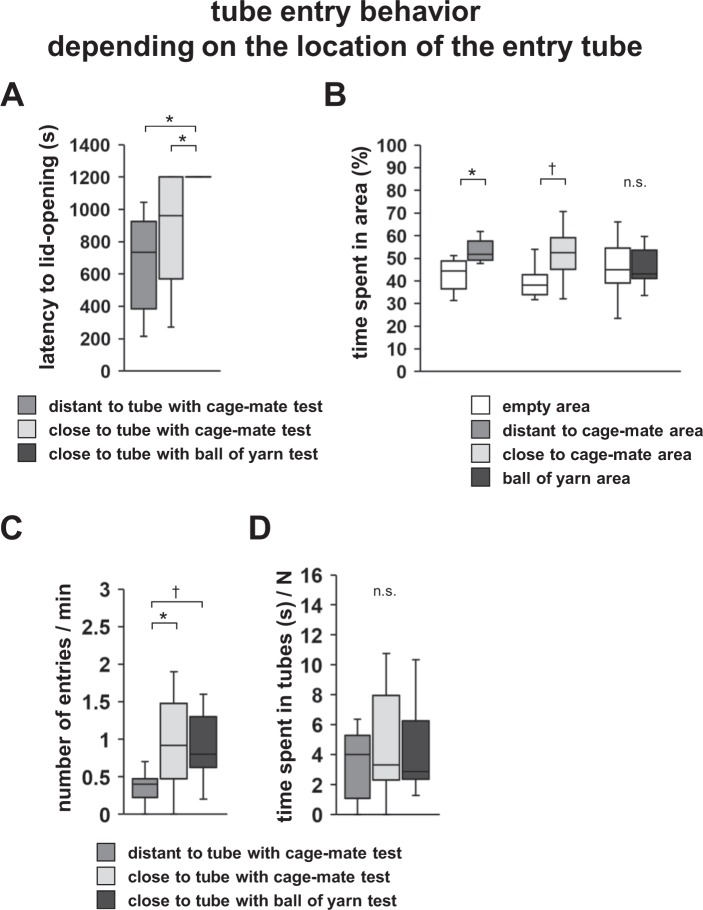
Figure 4.
Tube entry tests depending on the location of the tube. (A) Comparison of the latency to lid-opening in the three tests. (B) Comparison of the time spent in each area in the three tests. (C) Comparison of the number of entries to the empty tube in the three tests. (D) Comparison of the time spent in the empty tubes in the three tests. All data are presented as box plots. Statistical significance is represented as †p < 0.1 and *p < 0.05. n.s., not significant. The p values were calculated by one-way repeated measures ANOVA (A,C,D) and paired t-test (B). n = 10 animals per test.

