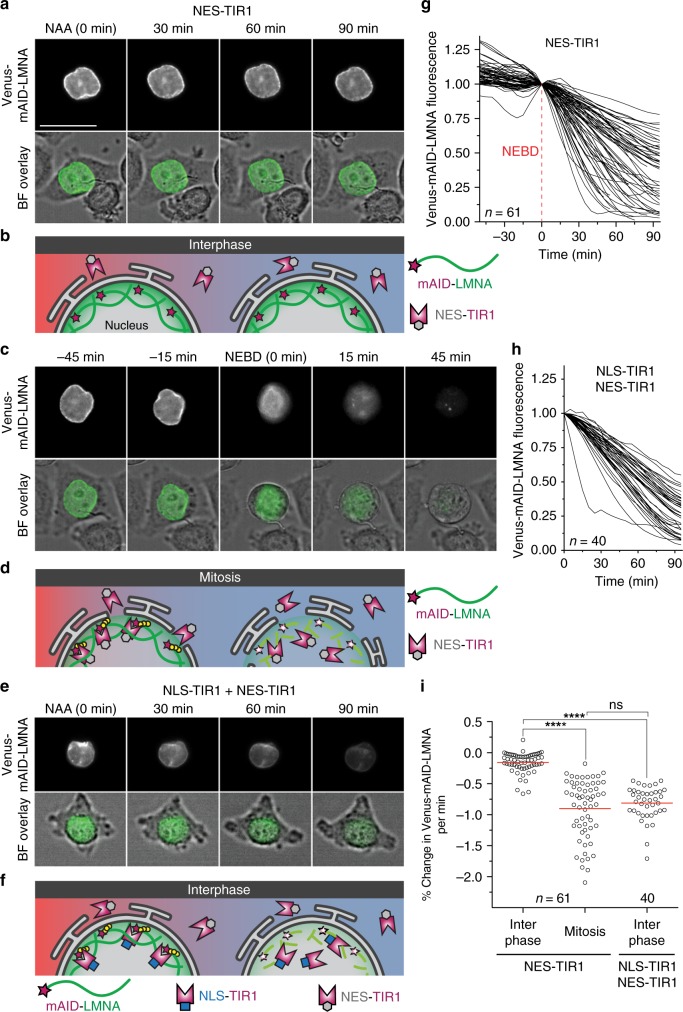
Fig. 8.
Localization of the ubiquitin ligase adaptor spatially controls degradation. a Representative time-lapse images of a HeLa cell transiently expressing a nuclear export signal-tagged ubiquitin ligase adaptor (NES-TIR1) and a Venus- and mAID-tagged lamin LMNA. 0.5 mM NAA was added at t = 0 to induce auxin-dependent degradation. During interphase, Venus-mAID-LMNA in the nuclear lamina is protected from ubiquitination by cytosolic NES-TIR1 and fluorescence persists in the presence of NAA. Scale bar: 30 µm. See also Supplementary Movie 5. b Model of mAID-LMNA protection from cytosolic NES-TIR1 during interphase. c The same cell is shown entering mitosis, which is visible by cell rounding in the brightfield (BF) overlay. After nuclear envelope breakdown (NEBD, t = 0), Venus-mAID-LMNA is accessible by cytosolic NES-TIR1 and fluorescence rapidly disappears. See also Supplementary Movie 6. d mAID-tagged reporters in the nucleus are accessible to cytosolic NES-TIR1 after NEBD occurs during mitosis. e Interphase HeLa cell stably expressing a nuclear localization signal-tagged TIR1 (NLS-TIR1) and NES-TIR1 from a single mRNA in addition to Venus-mAID-LMNA. After treatment with 0.5 mM NAA (t = 0), Venus-mAID-LMNA fluorescence rapidly disappears during interphase. See also Supplementary Movie 7. f Model of mAID-LMNA accessibility to nuclear NLS-TIR1 during interphase. g Quantification of Venus-mAID-LMNA fluorescence before and after NEBD (t = 0) in the presence of cytosolic NES-TIR1 and NAA. Values were normalized to NEBD. h Quantification of Venus-mAID-LMNA fluorescence in interphase cells in the presence of cytosolic NES-TIR1, nuclear NLS-TIR1, and NAA. Values were normalized to t = 0 (NAA addition). i Comparison of Venus-mAID-LMNA degradation velocities from single cells. The degradation velocity was determined for 45 min before NEBD (interphase) and 45 min after NEBD (mitosis) for NES-TIR1-expressing cells from three independent experiments or during the first 45 min after NAA addition for cells expressing both NLS-TIR1 and NES-TIR1 from two independent experiments. Bars indicate the mean of the indicated number of cells. Significance according to unpaired multi-comparison Kruskal–Wallis test with Dunn’s statistical hypothesis testing (****p < 0.0001; ns, p > 0.9999). Source data are provided as a Source Data file

