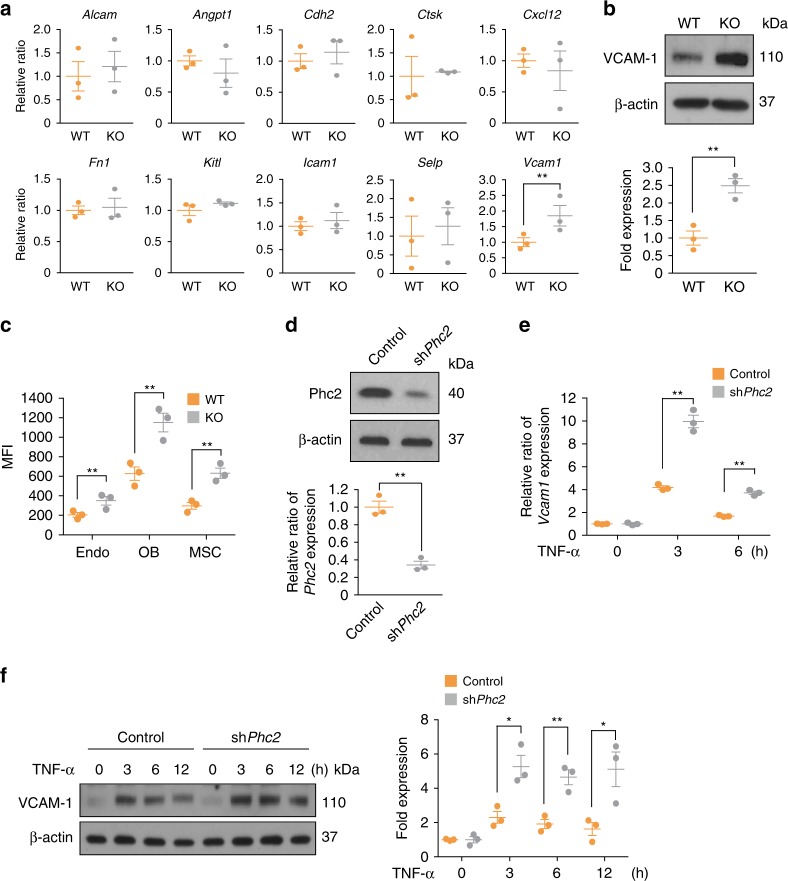
Fig. 5.
Phc2 inhibits VCAM-1 expression in BMSCs. a mRNA expression patterns of genes related to HSPC mobilization in BM niches from WT and KO mice were accessed by qRT-PCR. n = 3. b Lysates from WT and KO BMSCs were immunoblotted to analyze VCAM-1 expression. n = 3. c Mean fluorescence intensity (MFI) of VCAM-1 expression in BMSCs from WT and KO mice analyzed by flow cytometry. n = 3 Endo, endothelial cells; OB, osteoblasts; MSC, mesenchymal stem cells. d Control plasmid (Control) and shPhc2 plasmid (shPhc2) were transfected into BMSCs (OP9 cells). qRT-PCR (bottom) and immunoblot (top) analyses were then performed to measure the Phc2 expression levels. n = 3. e, f Control transfectants (Control) and shPhc2 transfectants (shPhc2) were treated with TNF-α for the indicated time period. qRT-PCR (e) and immunoblot (f) analyses were then performed to measure VCAM-1 expression. Relative fold change of each Vcam1 mRNA expression from Control or shPhc2 was calculated relative to the basal level of that in unstimulated Control or shPhc2, respectively. n = 3. Statistical significance was assessed by two-tailed Student’s t-test. *P < 0.05; **P < 0.01. All data are presented as the mean ± SEM. Source data are provided as a Source Data File

