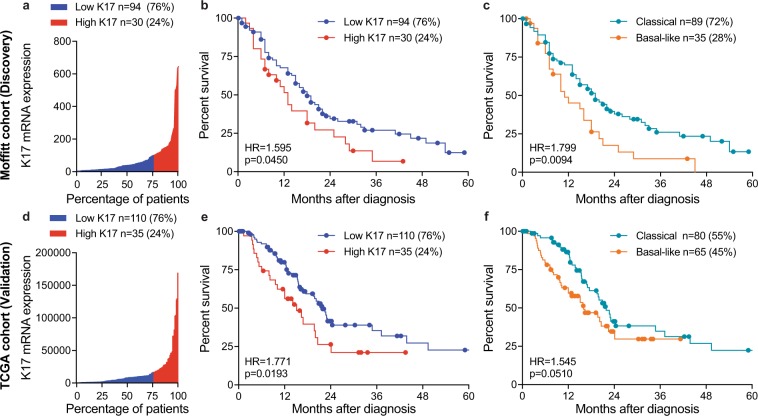
Figure 1.
K17 mRNA is as accurate as molecular subtyping to predict prognosis of PDAC. (a) Water plot depicts K17 mRNA expression levels in Moffitt et al. cohort22. 76th percentile defined the cut-off to predict outcome by maximum likelihood fit of a Cox proportional hazard model, 76% of PDAC cases were found to be low K17 (blue) while 24% of cases were classified as high K17 (red). K17 mRNA ranged from 3.559 to 645.377 absolute fluorescence reads. (b) Kaplan-Meier curve depicting the overall survival for K17 of resected PDAC primary tumors from Moffitt et al. cohort22. Cox proportional model was used for analysis. Hazard ratios (HR) and p-values are shown. (c) Kaplan-Meier curve of overall survival analysis for mRNA molecular subtypes of resected PDAC primary tumors from Moffitt et al. cohort22. For analysis, Cox proportional model was used. Hazard ratios (HR) and p-values are shown. (d) Water plot depicts K17 mRNA expression levels in The Cancer Genome Atlas (TCGA) cohort23. 76th percentile defined the best cut-off to predict outcome by the maximum likelihood fit of a Cox proportional hazard model, 76% of PDAC cases where found to be low-K17 (blue) while 24% of cases were classified as high-K17 (red). K17 mRNA ranged from 75.39 to 170,437.66 RSEM reads. (e) Kaplan-Meier curve depicting the overall survival for K17 of resected PDAC primary tumors from TCGA cohort23. Cox proportional model was used for analysis. Hazard ratios (HR) and p-values are shown. (f) Kaplan-Meier curve of overall survival analysis for mRNA molecular subtypes of resected PDAC primary tumors from TCGA cohort23. Cox proportional model was used for analysis. Hazard ratios (HR) and p-values are shown.

