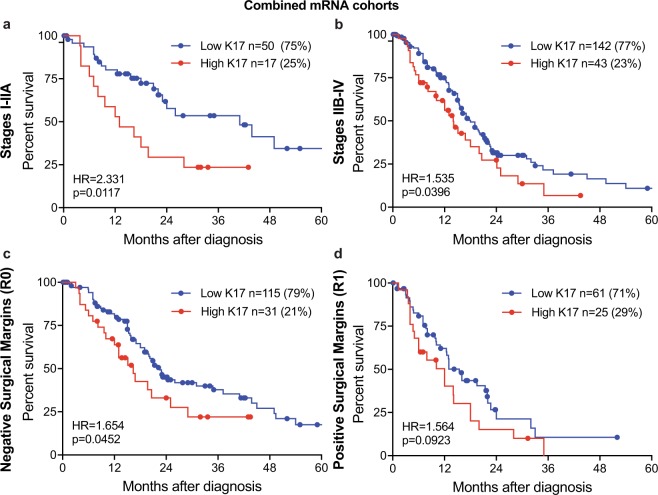
Figure 5.
K17 predicts survival based on stage and surgical margins at the mRNA level. (a–d) Kaplan–Meier curves depicting the overall survival of the combined mRNA cohorts (Moffitt et al.22 and The Cancer Genome Atlas [TCGA])23 integrating K17 status and tumor stage (a: stage I-IIA, b: stage IIB-IV) and surgical margins (c: negative margins, d: positive margins). P-values were calculated using the log-rank test. Hazard ratios (HR) and p-values are shown.

