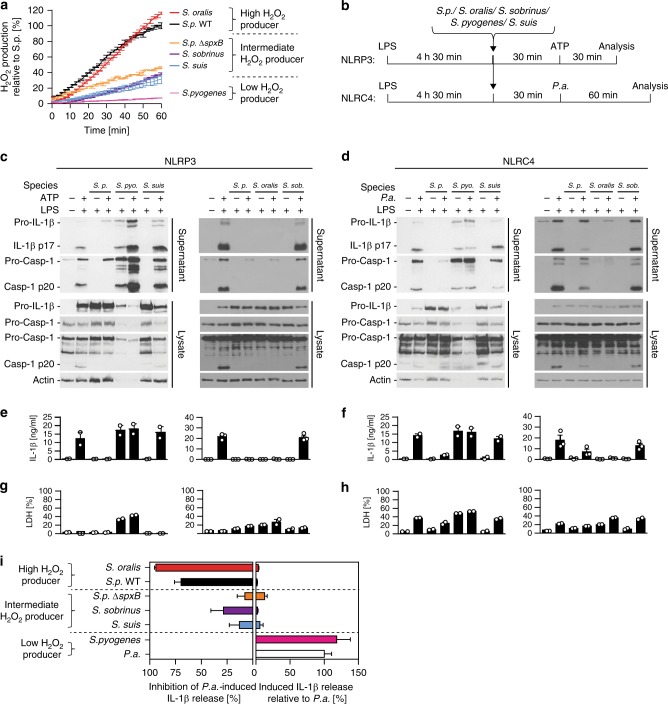
Fig. 5.
High H2O2-producing bacteria block inflammasome activation whereas low producers do not. a H2O2 production by S. oralis, S. pneumoniae ΔspxB (D39), S. sorbnius, S. suis, S. pyogenes relative to that by S. pneumoniae WT (D39) (100%). Data are representative of two independent experiments performed in duplicates or triplicates presented as the mean ± s.d. b Schematic diagrams of experimental setups used in (c–h). c, d Immunoblot analysis of Caspase-1 and IL-1β processing, e, f ELISA analysis of corresponding supernatants for IL-1β secretion and g, h LDH release of LPS-primed BMDMs pre-treated with S. pneumoniae D39 WT (S. p.), S. pyogenes (S. pyo.), S. suis, S. oralis or S. sobrinus (S. sob.) (MOI 40) for 30 min before c, e, g stimulation with ATP (5 mM) for 30 min or d, f, h infection with P. aeruginosa (MOI 20) for 60 min. Data in c and d are representative of two or three independent experiments, respectively. ELISA and LDH release data are from two or three independent experiments and are depicted as the mean ± s.e.m. i Relative inflammasome inhibition or activation by Streptococcus species presented as the mean ± s.e.m. Inhibition depicts decrease in P.a.-induced IL-1β release during co-infection with indicated bacteria. Activation depicts IL-1β release by indicated bacteria relative to that by P.a.. Data are presented as the mean ± s.e.m. of 2–9 experiments. Source data are provided as a Source Data file

