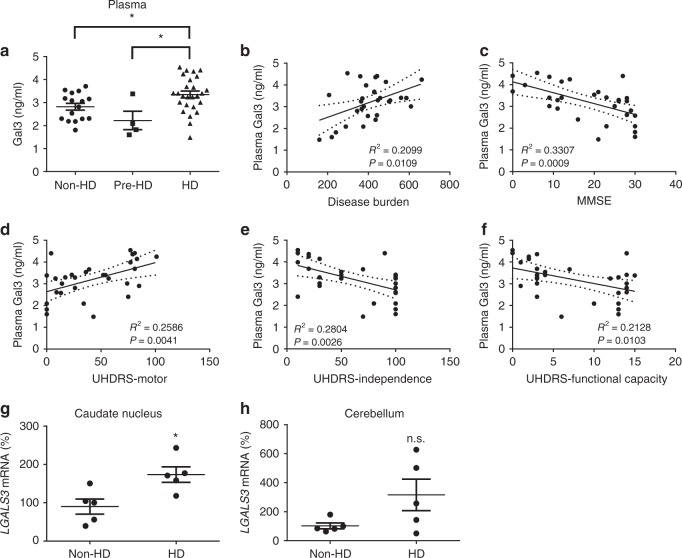
Fig. 1.
Up-regulation of Gal3 in the plasma and brains of HD patients. a The levels of plasma Gal3 of non-HD (n = 16), pre-symptomatic HD (Pre-HD, n = 4), and HD individuals (n = 26) were measured by ELISA. b–f Correlations between the plasma Gal3 levels of HD patients (n = 26) and their disease burden b, MMSE c, UHDRS-motor d, UHDRS-Independence e, or UHDRS-functional capacity f scores were analyzed by Pearson correlation coefficients. The levels of transcripts of LGALS3 in the g caudate nucleus and h cerebellum of HD patients or non-HD subjects were measured by RT-qPCR (n = 5 in each group). Each dot represents the plasma Gal3 level or the relative LGALS3 level of a subject. Data in (a) were analyzed by one-way ANOVA followed by Holm–Sidak’s multiple comparisons test, *P < 0.05. Data in g and h are presented as the means ± SEM and were analyzed by the unpaired Student’s t-test. *P < 0.05. n.s., not significant. Source data is available as a Source Data File

