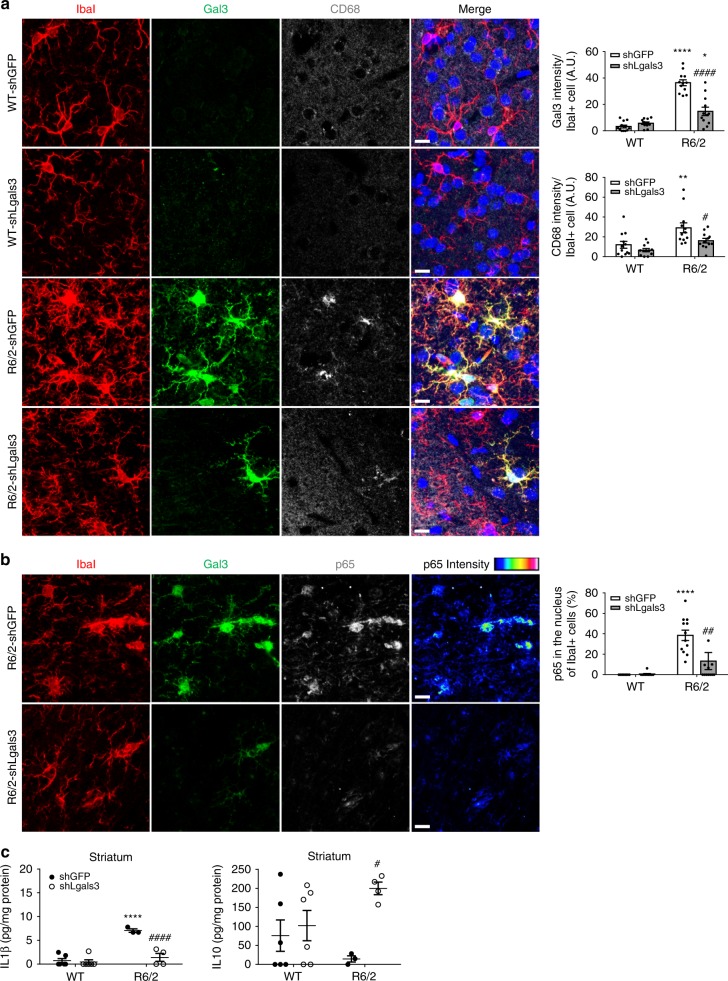
Fig. 7.
Knockdown of Gal3 in the brains of R6/2 mice reduces the activation of microglia. Mice of 6 weeks were intrastriatally injected with lentiviruses carrying the indicated shRNA and monitored for an additional 7 weeks. Brain tissues were carefully harvested and subjected to immunofluorescence assays using the indicated antibodies. Nuclei were stained with Hoechst (blue). a The expression levels of Gal3 (green), IbaI (red, a microglia marker), and CD68 (gray, a marker for activated microglia) in the striatum of the indicated mice were determined using immunofluorescence staining. b The expression levels of Gal3 (green), IbaI (red), and p65 (gray) in the striatum of the indicated mice were determined using immunofluorescence staining. The color bars labeled p65 intensity represent the level of p65 intensity, from low to high fluorescence signals (blue → red, respectively). Twelve image frames of each animal were analyzed (4 animals in each group). c Striatal homogenates were analyzed to determine the levels of IL1β and IL10 by ELISA. Each dot represents the mean value of each mouse (3–6 animals in each group). Data are presented as the means ± SEM. The results were analyzed by two-way ANOVA followed by Tukey’s post hoc test. *Specific comparison between WT and R6/2 mice infected with the same lentivirus; #Specific comparison between mice of the same genotype. *P < 0.05, **P < 0.01, ***P < 0.001, ****P < 0.0001. Same P-value denotation for #. Scale bar: 10 µm. Source data is available as a Source Data File

