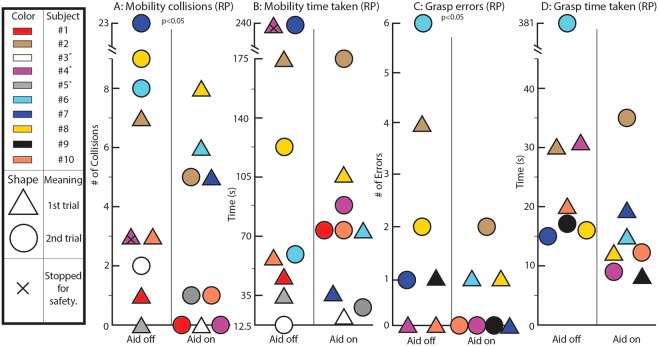
Figure 2.
Results from RP subjects. In these plots, each color corresponds to a different subject. “1st trial” and “2nd trial” refer to whether the subject was tested with AR first or second temporally; for example, subjects with a triangular shape in the “Aid on” column were tested with the pseudocolor encoding on first. The vertical axis is either the number of collisions during course performance or the time taken to complete the course. The horizontal axis, which has two discrete values, denotes whether AR was off or AR was on for that trial. (A) Number of collisions during obstacle course testing of eligible subjects with RP. (B) Time taken to complete obstacle course testing by eligible RP subject. (C) Number of errors (misidentification, collision, etc.) during RP grasp experiment. (D) Time taken to complete grasp experiment by eligible RP subject. An expanded version of this figure with bar charts is included as Supp. Fig. 5 for interpretability.

