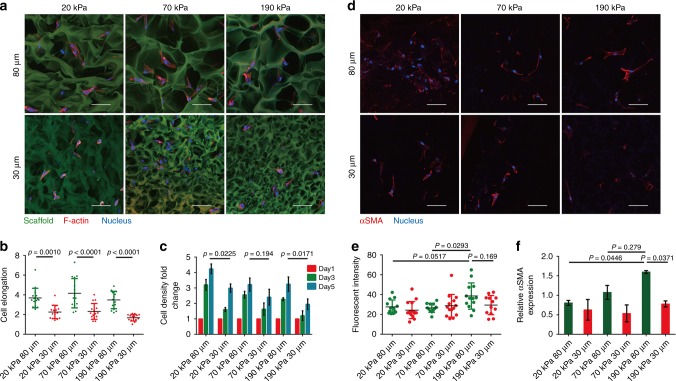
Fig. 3.
Fibroblasts respond to the stiffness and pore size of 3D porous scaffolds. a, b Confocal fluorescent imaging of F-actin-stained HDFs within auto-fluorescent scaffolds showing elongation of HDFs within large-pore scaffolds regardless of scaffold stiffness; whereas cell elongation only occurred in small-pore scaffolds with lower local stiffness (20 kPa) but not in stiffer scaffolds. Scale bar: 50 μm (n = 15). c Proliferation of HDFs inside the different porous scaffolds over 5 days of culturing (n = 3). d, e Significant αSMA expression with fiber-like accumulation was only observed in scaffolds with larger and stiffer pores (80 μm and 190 kPa). Scale bar: 50 μm. (n ≥ 12). f Gene expression levels for αSMA (n = 3). Data are means ± s.d. (ANOVA)

