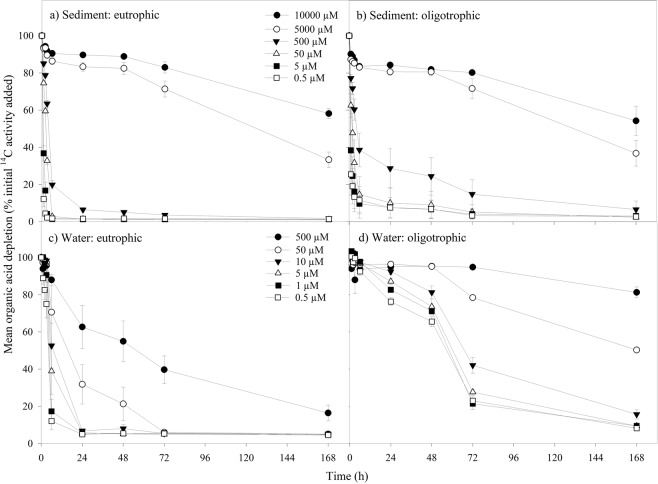
Figure 3.
Effect of DOC concentration on the loss of 14C-labelled organic acids for: (a) lowland improved grassland river sediments (mesotrophic), (b) upland peat bog sediments (oligotrophic), (c) lowland improved grassland river waters (mesotrophic), (d) upland improved grassland river waters (oligotrophic). Values represent means ± SEM (n = 3). Please note the legends are different for the top two panels (a and b) and bottom two panels (c and d) to represent the different concentration ranges found in each substrate type; sediment and water respectively. The legend is the same for the top two (a and b) and bottom two (c and d) panels respectively.

