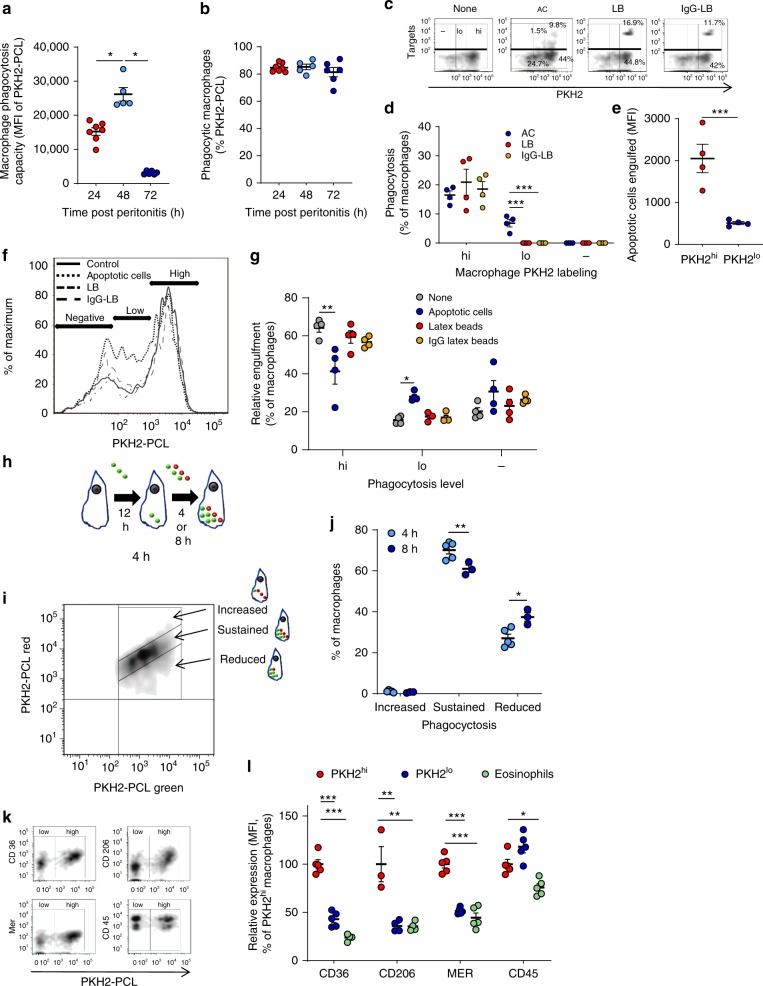
Fig. 9.
Characteristics of macrophages following loss of phagocytosis. a, b The phagocyte-specific dye PKH2-PCL green was injected I.P. to male WT mice undergoing peritonitis for 20, 44 and 68 h. After 4 h, the peritoneal cells were recovered and immuno-stained for F4/80 and CD11b. PKH2-PCL green acquisition by CD11bhigh macrophages was determined by flow cytometry. Results are means ± SEM (n = 8 mice for 24 h, 6 mice for 48 h, and 7 mice for 72 h) showing MFI (a) and the percentage of PKH2+ cells (b). *P < 0.05 (Tukey’s HSD). c–g Mice were injected i.p. with 3 × 10⁶ apoptotic Jurkat cells, latex beads, IgG-opsonized latex beads or vehicle together with PKH2-PCL red at 62 h PPI. 4 h later, the peritoneal cells were recovered, immuno-stained for F4/80 and CD11b and F4/80+ macrophages were analyzed by flow cytometry for target particle uptake and/or PKH2 engulfment (designated as PKH2-high, -low and -negative populations). Results are representative for three experiments presented as density or histogram plots (c, f) and means ± SEM from 4 independent experiments of % of phagocytic macrophages (d), particles engulfed (e), or PKH2 uptake (g). *P < 0.05, **P < 0.01 (Tukey’s HSD). h, i PKH2-PCL green was injected I.P. to mice at 44 h PPI followed by an injection of PKH2-PCL red at 58 h PPI. Peritoneal cells were recovered at 62 or 66 h PPI and immuno-stained for F4/80 and CD11b and analyzed with flow cytometry (as illustrated in h). PKH2-PCL green vs. red acquisition was determined in F4/80+ macrophages and macrophages that displayed increased, sustained or reduced phagocytosis (representative dot-plot is shown in i). j Data are means ± SEM (n = 5 mice for 4 h and 3 mice for 8 h). *P < 0.05, **P < 0.01 (Student’s t test). k, l PKH2-PCL red was injected I.P. to mice at 62 h PPI. 4 h later the peritoneal cells were recovered, immuno-stained for CD36, CD206 or MER, receptors involved in apoptotic cell uptake. Staining for CD45 served as a control. Receptor expression on PKH2-PCL-high (PKH2hi) or PKH2-PCL-low (PKH2lo) macrophages was determined by flow cytometry. Results are representative from n = 4 mice presented as dot plots (k) and means ± SEM relative MFI normalized to PKH2hi macrophage expression (l). *P < 0.05, **P < 0.01, ***P < 0.005 (Student’s t test). Source data are provided as a Source Data file

