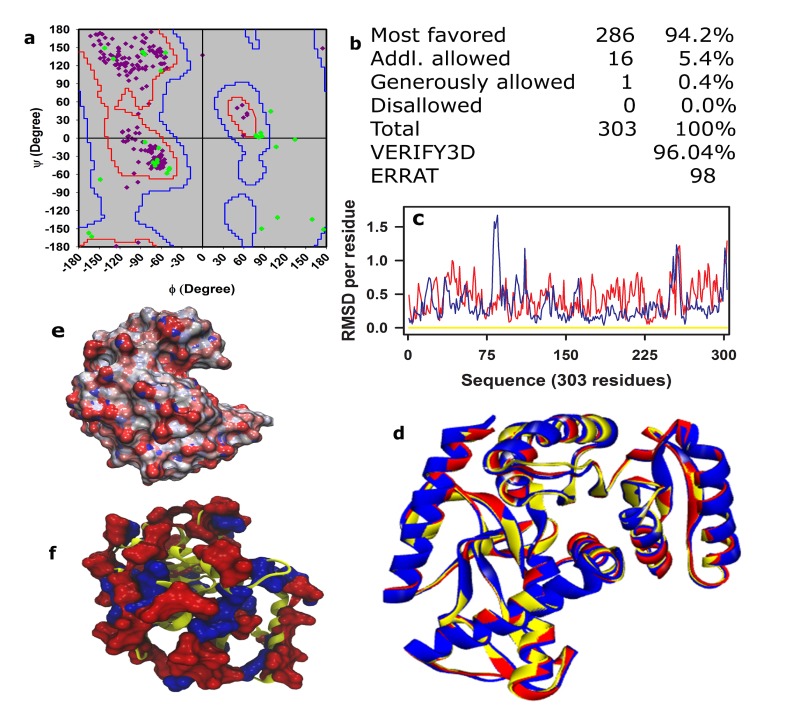
Figure 1.
Evaluations and surface characteristics of the model of hsMDH. Evaluations are performed using (a) Ramachandran plot, (b) quantitative distribution values of Ψ and Φ for different regions using PROCHECK [36], (c) per residue RMSD and (d) average RMSD. Average and per residue RMSD that compares model structure (red; d) and 4CJO (Blue, hmMDH; d) with reference structure 4BGU (template, yellow; d) using VMD [37]. Electrostatic surface potential of the model structure, which was obtained using APBS [38] at neutral pH, was projected onto the molecular surface of the model (e). The distribution of negative (red) and positive (blue) charged residues of the model are shown in (f).

