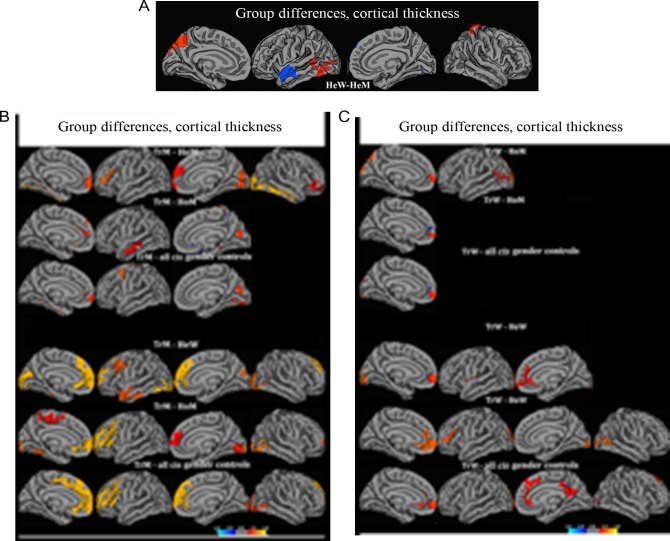
Figure 1.
Group differences in cortical thickness. Contrasts calculated at P < 0.05, FWE corrected for multiple comparisons (Monte Carlo permutation). The projection of cerebral hemispheres (MR images of the FreeSurfer atlas) is standardized. Scale is logarithmic and shows –log10 (P), with cool colors indicating negative contrast, and warm colors positive contrast. (A) Comparison between cisgender heterosexual men and women. (B) Comparisons between transgender men and controls. (C) Comparisons between transgender women and controls. The figures illustrate how significant clusters depend on whether the cisgender control groups are comprised of homosexual or heterosexual persons, or a mix of both. HoM, homosexual men; HeW, heterosexual women; HoM, homosexual men; HeM, heterosexual men. TrM, transgender men; TrW, transgender women.

