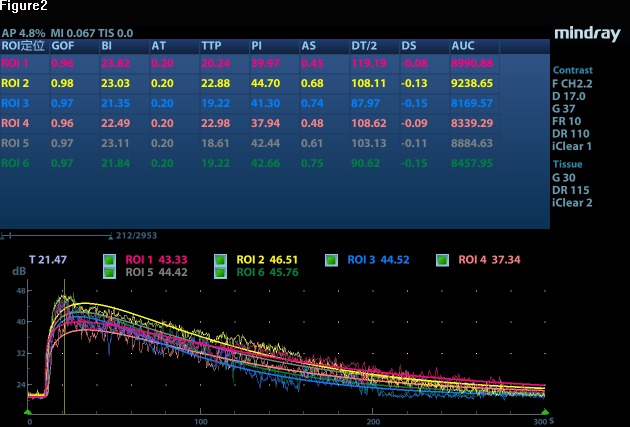
Figure 2.
A color-coded graph comparing the quantitative contrast-enhanced ultrasound parameters between the groups with and without acute kidney injury. AS, ascending slope; AT, arrival time; AUC, area under the curve; BI, baseline intensity; DS, descending slope; DT/2, descending time/2; GOF, goodness of fit; PI, peak intensity; TTP, time-to-peak.

