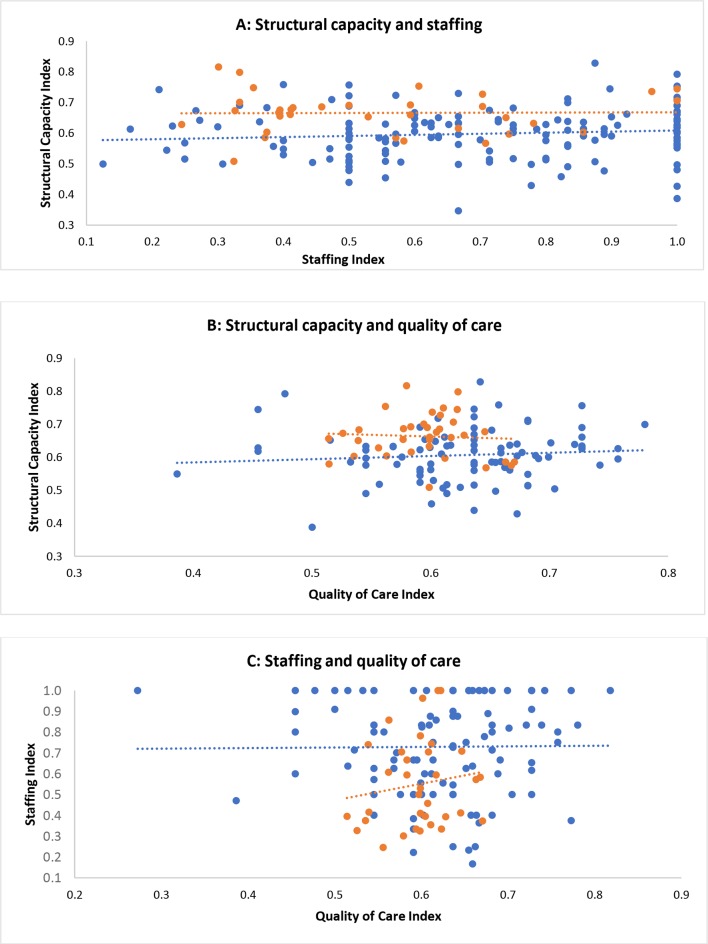
Figure 3.
Structural capacity, staffing and quality of care relationship for primary health centres (PHC) (blue) and district hospitals (DH) (orange). Each point represents the indexes for each facility (PHC or DH). The trend line shows the relationship between the staffing and quality of care across the PHCs (blue) and DHs (orange). Note that axis scales vary.

