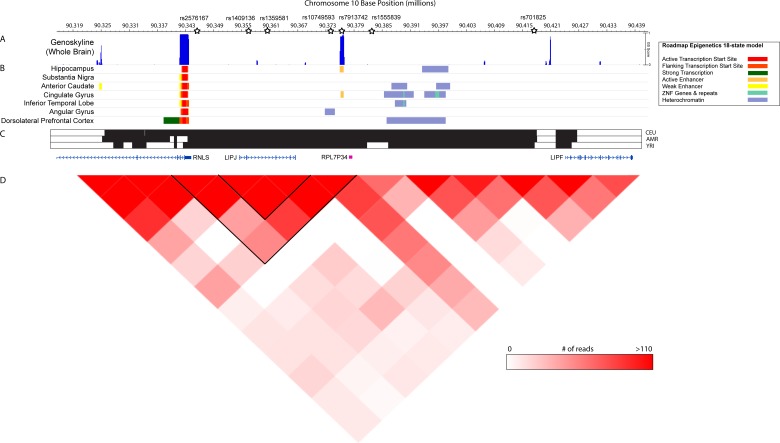
Figure 3.
Epigenetic examination of chromosome 10q23.31 containing the top-performing SNPs in the GRaD discovery analysis. (A) Plot of GS scores obtained from GenoSkyline indicating the posterior probability for functionality in the brain at each genomic locus. A GenoSkyline (GS) score of 1 indicates a high probability for functionality, while a GS score of 0 suggests no functionality. (B) 18-state chromatin model from Roadmap Epigenomics Project showing predicted chromatin states based on the presence of H3K4me3, H3K4me1, H3K36me3, H3K27me3, H3K9me3 and H3K27ac sampled across different regions of the brain. (C) Location of genes implicated in the GRaD discovery analysis, and location of linkage disequilibrium blocks (black bars) in CEU, AMR and YRI populations in 1000 Genome Project Phase 3. (D) Chromatin contact map of adult hippocampal tissue showing regions of chromatin interactions at 10 kB resolution. Open stars represent the position of top chromosome 10q23.31 SNPs in the GRaD multivariate genome-wide association study (GWAS) analysis. AMR, Ad Mixed American; GRaD, Genes, Reading, and Dyslexia study.

