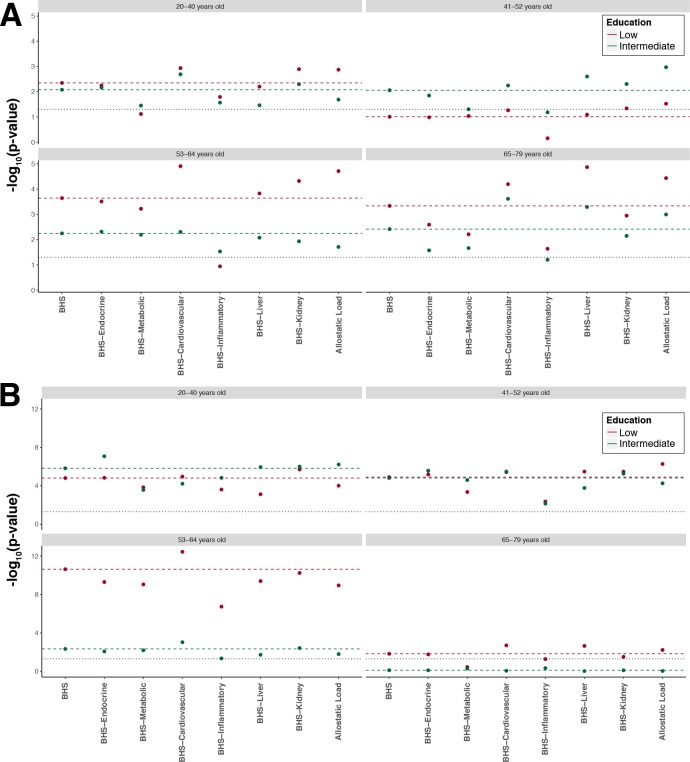
Figure 2.
Sensitivity analysis investigating changes in p value induced by the exclusion of each system separately from the Biological Health Score (BHS). We report on the x axis the different scores considered (ie, removing one system at a time or both kidney and liver functions to mimic the allostatic load). The p value reported on the y axis measures, in each age group and gender, the significance of the difference between the mean score in the low (red) and intermediate (green) educational level group compared with the mean score in the reference group (higher education). As a reference, we report results from the full BHS (horizontal coloured dashed line). Results are presented for each age class separately in men (A) and women (B), and the black horizontal dotted lines represent the 0.05 significance level.

