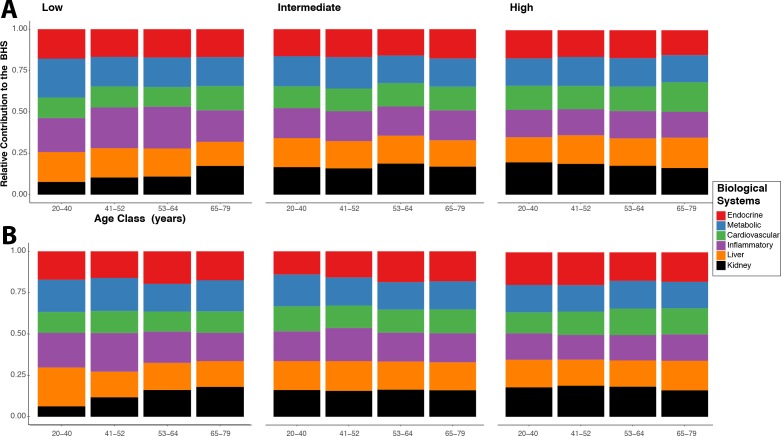
Figure 3.
Relative contribution of each system-specific subscore to the Biological Health Score (BHS). Results are presented for men (A) and women (B) separately, and for each group of educational level: low (left), intermediate (middle) and high (right). To account for the differential number of biomarkers assayed in each system, the contribution is calculated based on a normalised system-specific score.

