Figure 2.
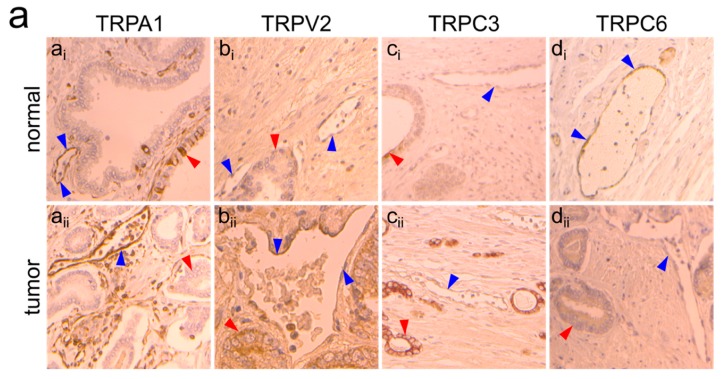
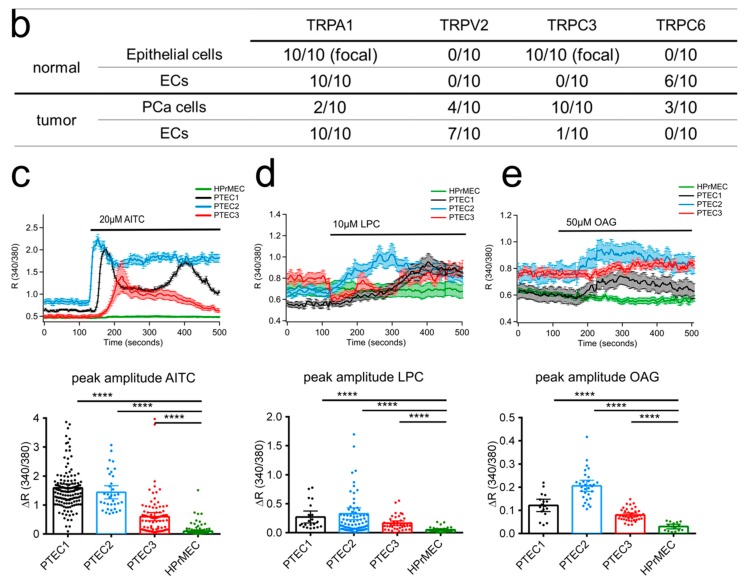
Protein expression of ‘prostate-associated’ genes in PTEC and HPrMEC. (a) (panel ai, ×20) TRPA1 expression in normal areas: focal positive staining in epithelial cells (red arrows) and diffuse staining in ECs (blue arrows). (panel aii, ×20) In tumor areas, TRPA1 expression is observed in all cases (n = 10/10) in ECs (blue arrows), with negative staining in tumor cells (red arrows). (panel bi, ×40) In histologically normal areas, TRPV2 expression is not observed in ECs (n = 0/10) (blue arrows) or epithelial cells (red arrows). (panel bii, ×40) Positive endothelial TRPV2 expression was observed in 7 of 10 cases in the tumor areas (blue arrows), with positive staining in cancer cells in 4 cases (red arrow). TRPC3 expression: (panel ci, ×40) all normal tissues showed negative staining (n = 10/10) in ECs (blue arrows) with focal positive staining in epithelial cells (red arrow). (panel cii, ×10) Only one tumor (n = 1/10) showed faint positive TRPC3 staining on ECs (blue arrow), whereas cancer cells were positive (red arrows) in all cases. (panel di, ×20) TRPC6 expression was observed in ECs in histologically normal tissues (n = 6/10), (panel dii, ×40) whereas TRPC6 expression was absent in cancer cells in 7 out of 10 patient samples (red arrows). (b) Summary of endothelial and epithelial expression of the four ‘prostate-associated’ candidates in both normal and tumor areas for the ten patient samples used for immunohistochemical analysis. The patients were 62 to 70 years old, with PCa classified as ISUP group 2 in six cases and group 3 in four cases. Ca2+- imaging traces in response to TRPA1, TRPV2 and TRPC3 agonists respectively (c) 20 µM AITC), (d) 10 µM LPC and (e) 50 µM OAG in PTEC1 (black), PTEC2 (blue) and PTEC3 (red) but not in HPrMEC (green).Traces represents mean ± SEM of cells in the recorded field of one representative experiment. Lower panel: histogram showing peak amplitude of TRP agonist-mediated Ca2+ responses (mean ± 95% CI of different cells in the field from at least 3 independent experiments). Statistical significance and ****: p-value < 0.0001 (Kruskal-Wallis test).


