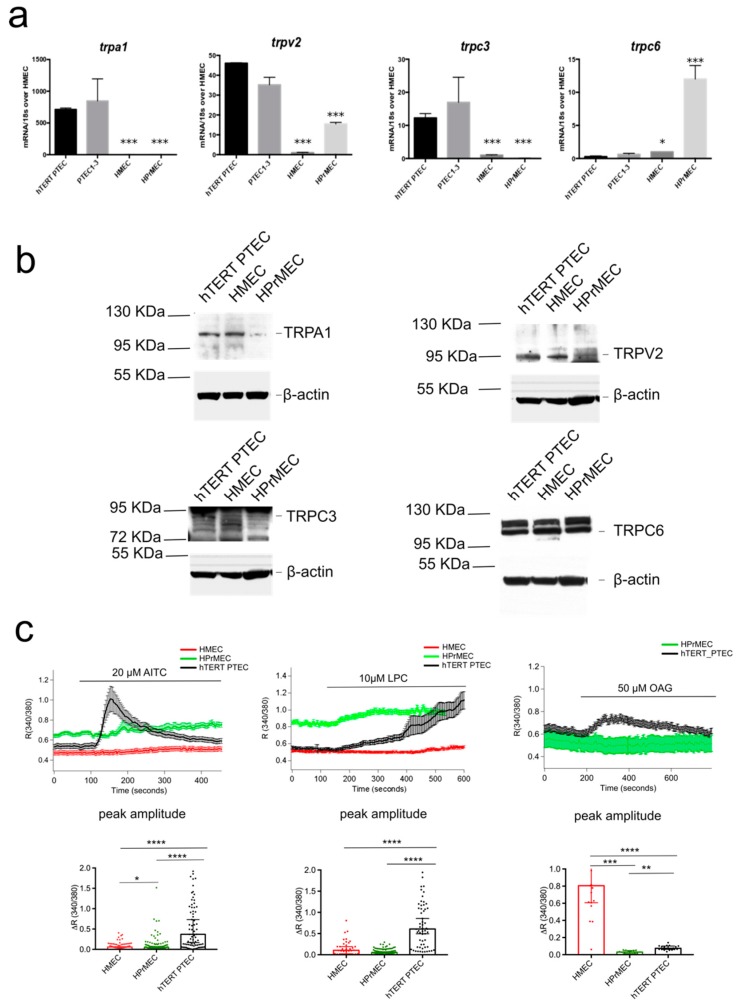
Figure 4.
hTERT PTEC validation as cellular model for TEC studies. (a) Real-time qPCR analysis validating equal amount of mRNA expression if trpa1, trpv2, trpc3 and trpc6 in hTERT PTEC compared to PTEC1-3, as well as deregulated expression compared to HMEC and HPrMEC. Values are expressed as the mean ΔΔCT values ± SEM of three independent experiments. (b) Representative immunoblots blots (n = 3) showing similar TRPA1, TRPV2 and TRPC3, and TRPC6 expression in hTERT PTEC compared to PTEC1, 2 and 3. Β-actin was used as a loading control. (c) Ca2+- imaging traces in response to TRPA1, TRPV2 and TRPC3 agonists respectively 20 µM AITC), 10 µM LPC and 50 µM OAG in HMEC (red), HPrMEC (green) and hTERT PTEC (black). Traces represents mean ± SEM of all cells in the recorded field of one representative experiment. Lower panel: histogram showing peak amplitude of TRP agonist-mediated Ca2+ responses (median ± 95% CI of different cells in the field from at least three independent experiments). Statistical significance *: p-value < 0.05, **: p-value < 0.005 and ****: p-value < 0.0001 (Kruskal-Wallis test.).

