Figure 7.
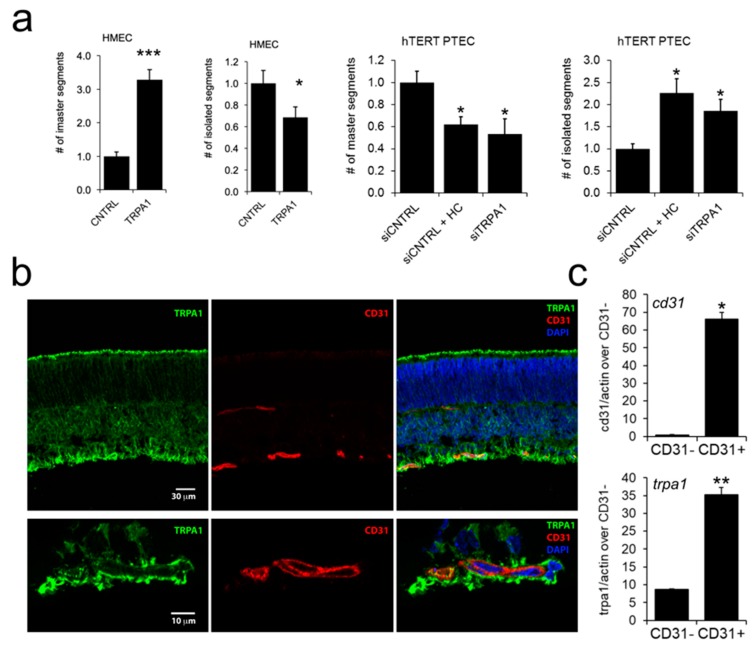
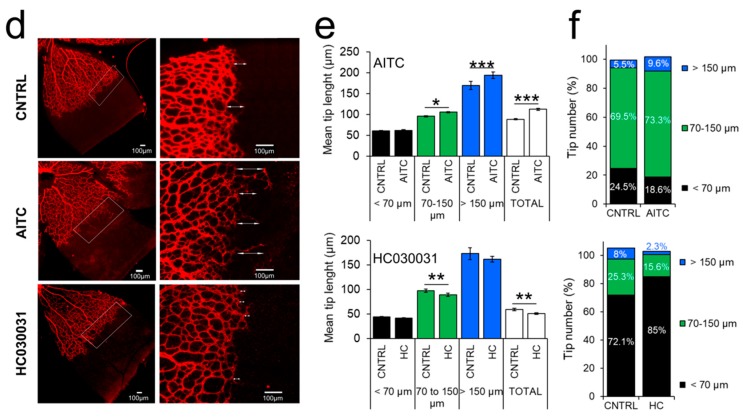
TRPA1 promotes in vitro tubulogenesis and in vivo angiogenesis. (a) left panels: TRPA1-overexpressing HMEC display increased in vitro tubulogenesis in Matrigel compared to control cells; right panels: TRPA1-downregulating hTERT PTEC display decreased in vitro tubulogenesis in Matrigel/collagenI substrate compared to control cells; bar graphs show the quantification of number of master segment and the number of isolated segments of control HMECs and TRPA1-overexpressing HMECs. Three independent experiments were performed 24 h after overexpression or after II oligofection pulse. (b) Endogenous TRPA1 is diffusely expressed in postnatal mouse retina but clearly co-localizes with CD31 staining, indicating that TRPA1 is found in ECs. (c, upper panel): analysis of CD31 levels by qPCR in a fraction of CD31-enriched cell population isolated from the mouse retina (CD31+) compared to the depleted cell population (CD31−); (c, lower panel): analysis of TRPA1 mRNA expression by qPCR in a fraction of CD3-enriched cell population isolated from the mouse retina (CD31+) compared to the depleted cell population (CD31−). Values are expressed relative to actin expression. Statistical significance *: p-value < 0.05, **: p-value < 0.005 and ***: p-value < 0.0005 vs. control. (d) Subretinal injection of AITC or HC030031 did not alter the overall development of the vascular plexus 3 days after treatment, but the front of growing vasculature became uneven after injection of the TRPA1 agonist AITC in the subretinal space. (e, upper panel) This was illustrated by a significant increase of 26.8% in the length of sprouts (white bars): quantification of tip cell length during mouse retinal angiogenesis shows that compared to that in controls, tip cell length increased significantly 3 days post-intravitreous injection of 200 µM AITC. (e, lower panel): Treatment with TRPA1 inhibitor (200 µM HC030031) induced a decrease in tip cell length. Cell lengths were either classified into three groups according to ranges (<70 µm, 70–150 µm, >150 µm) or considered altogether (total). Bars represent the mean ± SEM of each length range or total grouping. (f, upper panel): Percentage of tip cells with each length range shows that treatment with AITC induces a decrease in the number of short tip cells (<70 µm) and an increase in the number of medium and long tip cells (>70 µm). (f, lower panel): Inhibition of TRPA1 with HC030031 induces the opposite effect, increasing the number of short tip cells and decreasing the number of medium and long tip cells.


