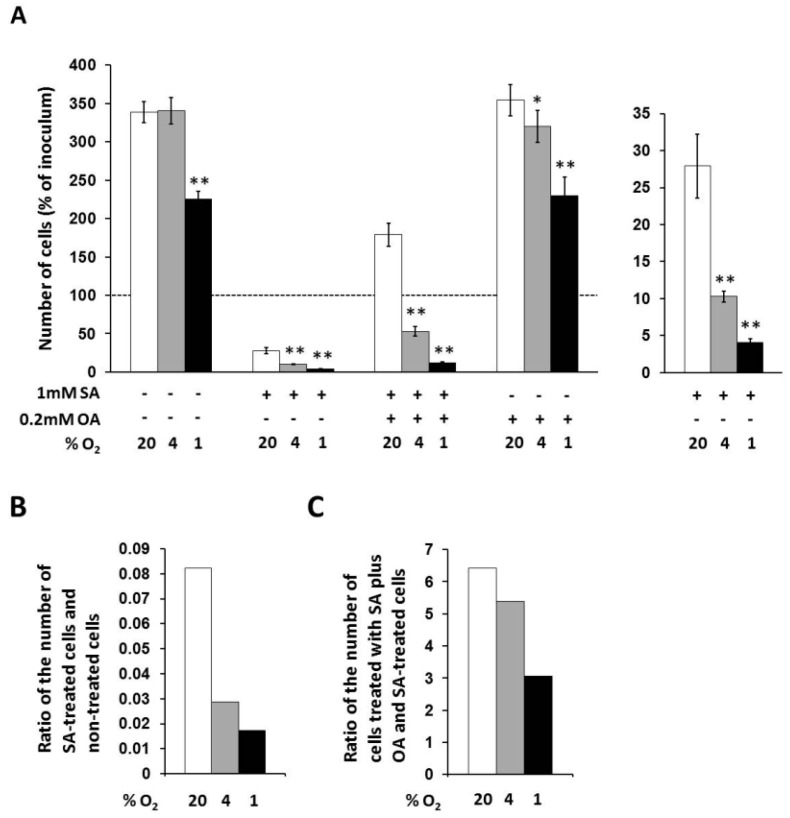
Figure 2.
(A) Effects of hypoxia applied alone and simultaneously with 1 mM stearic acid (SA), 1 mM SA plus 0.2 mM oleic acid (OA), and 0.2 mM OA (see “Materials and Methods”) on cell growth and viability of NES2Y cells. (B) Effect of hypoxia on cell growth and viability of NES2Y cells treated with SA when compared to cells without fatty acid (ratio of the number of SA-treated cells and non-treated cells). (C) Effect of hypoxia on cell growth and viability of NES2Y cells treated with SA plus OA when compared to SA-treated cells (ration of the number of cells treated with SA plus OA and SA-treated cells). The number of living cells was determined after 48 h of incubation in the presence of hypoxia (4% and 1% O2) or under control conditions (20% O2). Each column represents the mean of three experimental values ± SEM. * p < 0.05, ** p < 0.001 when comparing the effect of a particular hypoxia with external normoxia. The dotted line represents the number of cells of inoculum.

