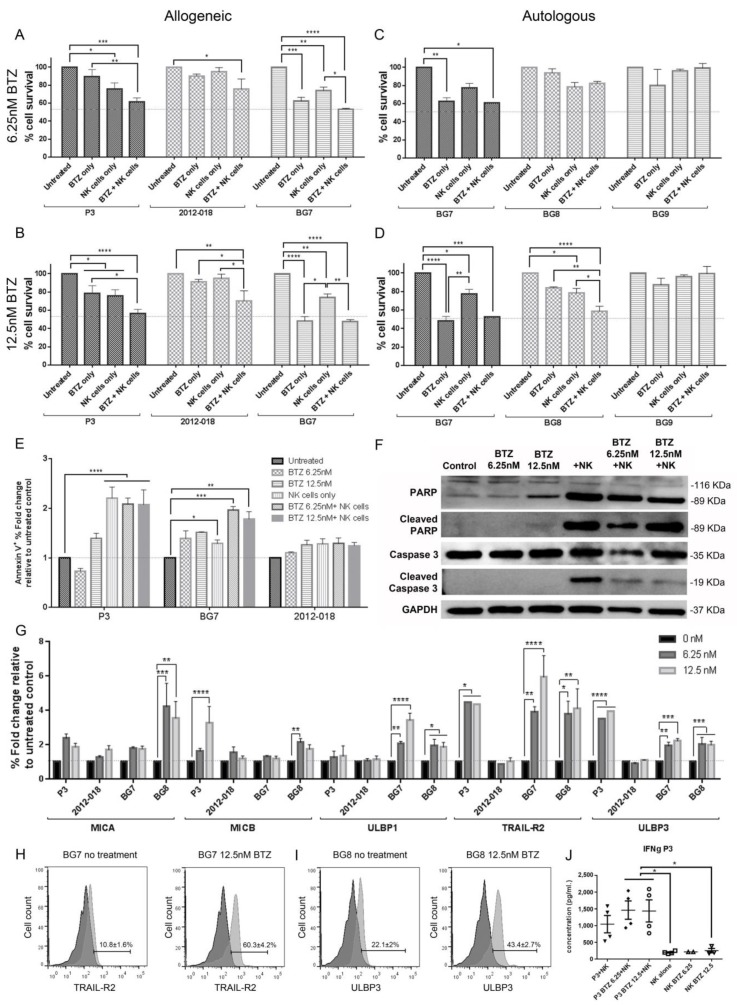
Figure 2.
Combination treatment of bortezomib and NK cells against GBM cells. The % fraction of surviving P3, 2012-018 and BG7 cells treated with bortezomib (BTZ), with 5:1 of NK cells or in combination BTZ and 5:1 of NK cells; treated with allogeneic NK cells and (A) 6.25 nM or with (B) 12.5 nM BTZ, or treated with autologous NK cells and (C) 6.25 nM or (D) 12.5 nM BTZ. (E) The % fold change relative to the untreated control of early apoptotic (Annexin V+) P3, BG7 and 2012-018 GBM cells after treatment with 6.25 nM BTZ, 12.5 nM BTZ, 5:1 NK cells and combination of 6.25 nM or 12.5 nM BTZ with 5:1 NK cells. (F) Western blot analysis of poly (ADP-ribose) polymerase (PARP) and caspase 3 proteins in lysates (20 µg of protein) from P3 cells untreated or treated with 6.25 nM and 12.5 nM BTZ, 5:1 NK cells or combination 6.25 nM and 12.5 nM of BTZ+5:1 NK cells. Glycerol-3-phosphate dehydrogenase (GAPDH) was used as a loading control and for the normalization of densitometry measurements. (G) The % fold change relative to untreated control cells (black) in P3, 2012-018, BG7 and BG8 of NKG2D ligands: MICA, MICB, ULBP1, ULBP3, and the receptor TRAIL-R2 after treatment with 6.25 nM (dark grey) and 12.5 nM (light grey) of BTZ. Histograms showing expression of (H) TRAIL-R2 in BG7 and (I) ULBP3 in BG8 cells without treatment and after 12.5 nM BTZ for 24 h. (J) Concentration in pg/mL of IFNγ, from ELISA, in supernatants of P3 GBM cells under the different treatment conditions. Data represents the mean ± SEM of n = 3 independent experiments. Two-way ANOVA, Bonferroni’s multiple comparison test, * P < 0.05; ** P < 0.01; *** P < 0.001; **** P < 0.0001. Lysates for proteins shown in Western blots in Figure 2F and Figure 3A are from the same experiment, and blots represent two independent experiments.

