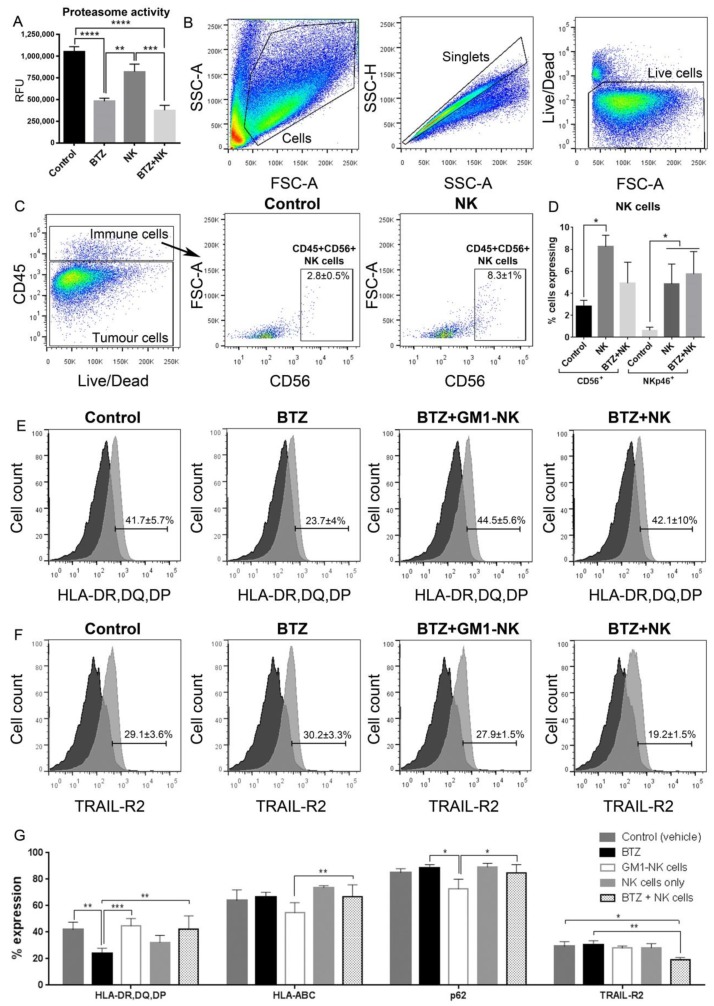
Figure 6.
Marker expression of the in vivo experiment. (A) Relative fluorescence units (RFU), as a measure of 20S proteasome activity, in dissociated brains from mice from each of the treatment groups indicated. Flow cytometry gating strategy of dissociated tumour-bearing mouse brains (from left to right): (B) cells, singlets and live cells and (C) CD45- tumour cells/CD45+ immune cells, CD45+CD56+ NK cells in control and NK-cell-treated mice. Bar graph showing (D) % of CD45+CD56+ and CD45+CD56+NKp46+ NK cells and One-way ANOVA, Bonferroni’s multiple comparison test. Histograms showing (E) HLA-DR, -DQ, -DP and (F) TRAIL-R2 expression in tumour cells from control, BTZ-treated, BTZ+GM1-treated NK cells and mice treated with BTZ+NK cells (control FMOs black and stained sample grey). (G) % of cells expressing HLA-DR, -DQ, -DP, HLA-ABC, p62 and TRAIL-R2 in dissociated brains from mice from each of the treatment groups indicated. Brains used in flow cytometry were from animals sacrificed in the following range of days after starting of experiment: 67–74 days Control, 73–83 days BTZ, 74–104 days NK cells, 70–74 days BTZ+GM1-NK and 65–80 days BTZ+NK cells. Data represents the mean ± SEM of n = 3–6 dissociated brains/treatment group. Two-way ANOVA, Bonferroni’s multiple comparison test, * P < 0.05; ** P < 0.01; *** P < 0.001; **** P < 0.0001.

