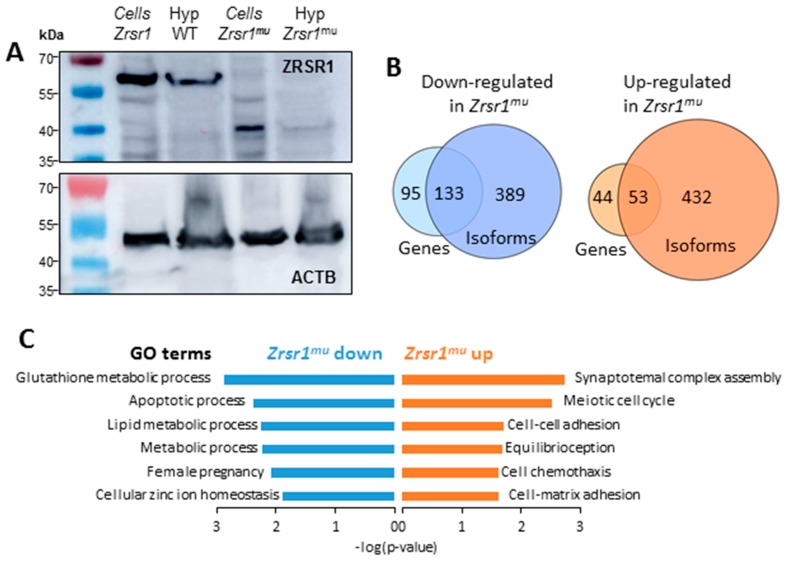
Figure 1.
ZRSR1 expression in HEK293 murine cell lines and in mouse hypothalami. Numbers of differentially expressed genes (DEG) and differentially expressed isoforms (DEI). Significantly enriched Gene Ontology (GO) terms (p < 0.05) in DEGs. (A) Western blot analysis of ZRSR1 protein expression. Lanes 1 and 3 correspond to the murine cell lines expressing mZrsr1 and mZrsr1 truncated protein, respectively. Expression of ZRSR1 in wild-type (WT) mouse hypothalamus and Zrsr1mu mouse hypothalamus is shown in lanes 2 and 4. Actin was used as the loading control (lower panel). (B) Venn diagram showing the correspondence between up- and down-regulated genes and isoforms in the comparison between Zrsr1mu and WT mouse hypothalami. (C) Significant GO terms in DEGs in the pairwise comparison.

