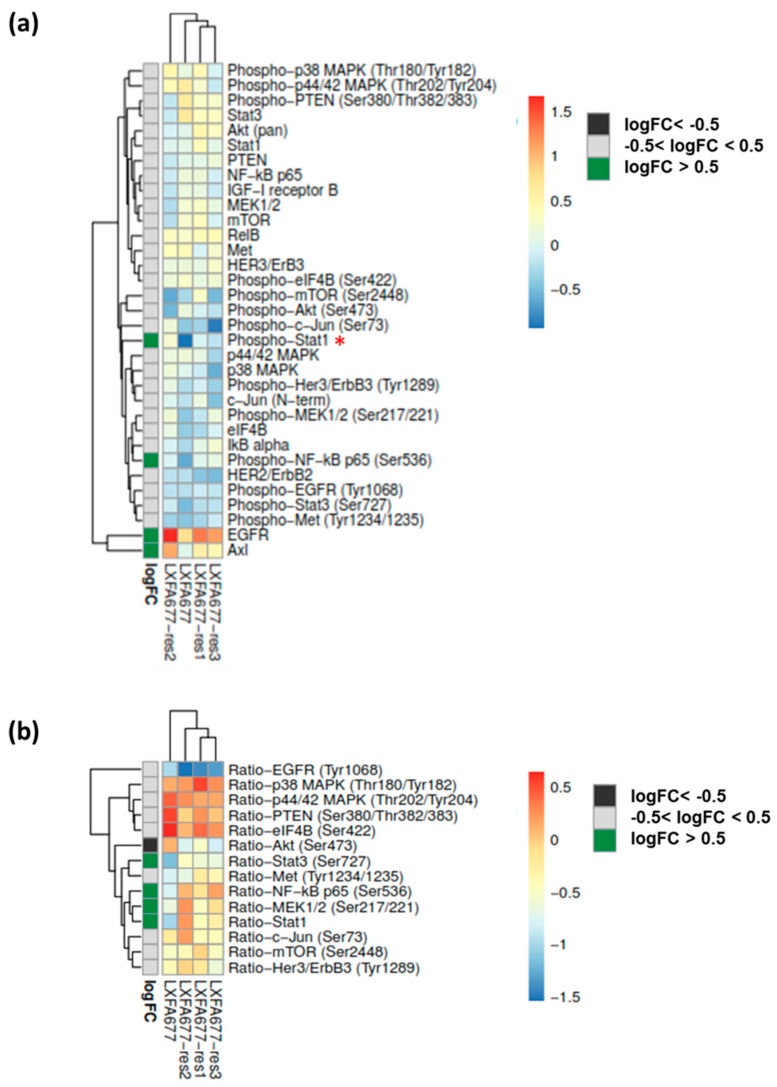
Figure 4.
The proteomic landscape was determined by RPPA analysis of four different sublines of LXFA 677. The median corrected normalized values were used for all subsequent data analyses. The logarithmic fold change (logFC) was calculated comparing the sum of all resistant lines with the treatment naïve tumor. (a): Hierarchical clustering of average protein expression across five dilutions. (b): Hierarchical clustering of average phosphor- to total protein ratios across five dilutions.

