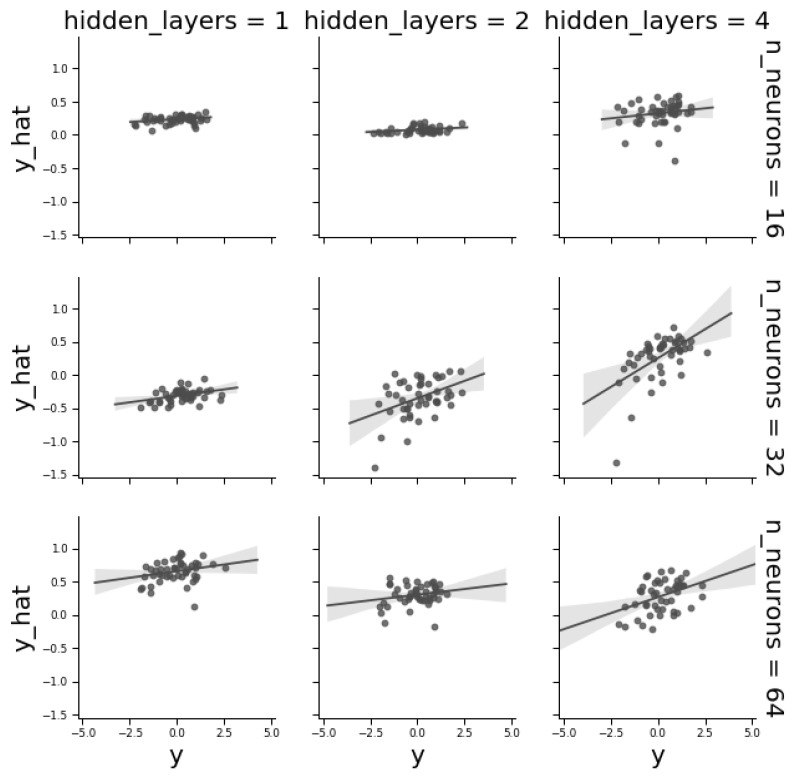
Figure 5.
Correlations between observed and predicted phenotypes in the validation dataset as a function of the number of layers and of number of neurons per layer for the CYMMIT wheat data. Each dot corresponds to a single phenotype in the validation dataset. The best combination was 32 neurons and four hidden layers (correlation = 0.55).

