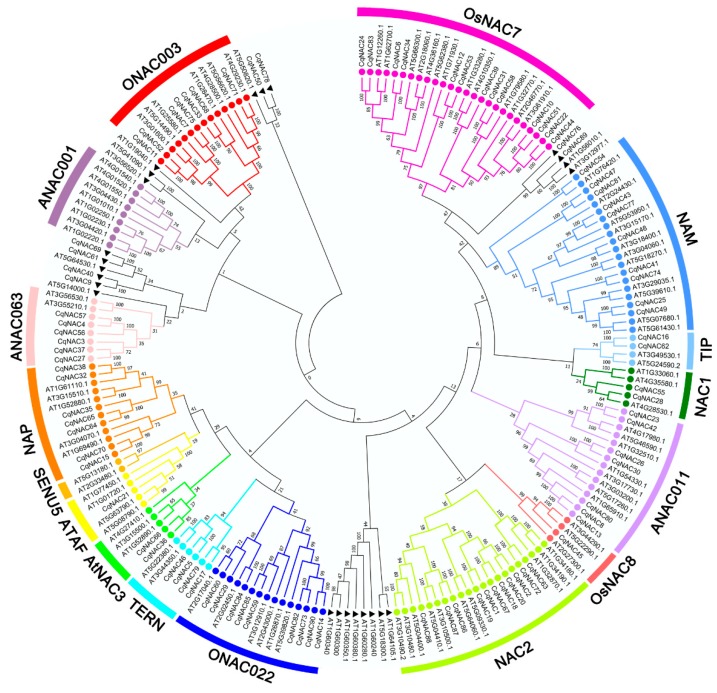
Figure 1.
Phylogenetic relationships of the NAC family in quinoa and Arabidopsis. Full-length amino acid sequences were aligned using ClustalW, and the phylogenetic tree was constructed using the MEGA7 method. The subfamilies are labeled and indicated with different colors. The NACs labeled with a black triangle indicate no group members. The numbers at the nodes represent bootstrap support values from 1000 replicates.

