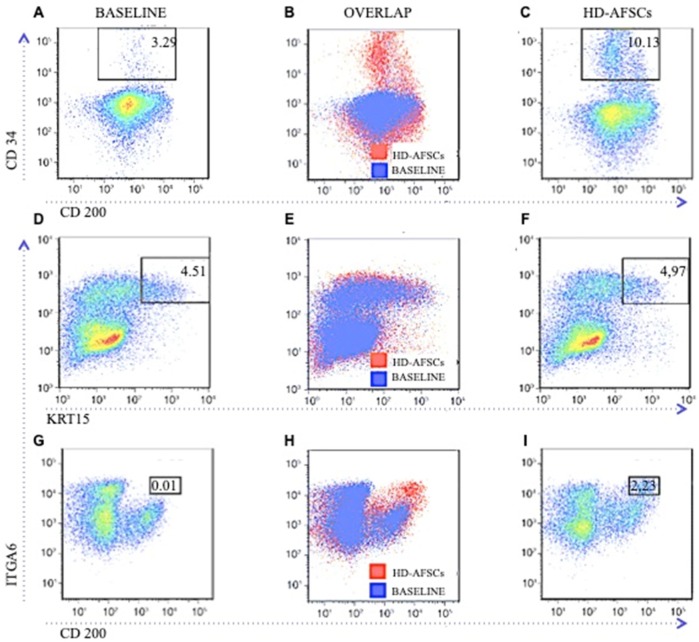
Figure 5.
Preservation of KRT15 hair follicle stem cells in baseline and after HD-AFSCs treatment, with improvement of CD200, ITGA6, and CD34 progenitor cells in targeted area. Pseudocolor dot plots (A,C,D,F,G,I) or overlap graphs (B,E,H) from FACS analysis of epithelial cells stained with the indicated antibodies. Overlap graphs are plotted first with cells from HD-AFSCs-treated scalp, then layered over with cells from baseline. (D–F) Representative example showing KRT15 cells preserved in baseline (p = 0.5). In contrast, a defined population of CD200 ITGA6 cells (G–I; p = 0.003) and CD34 cells (A–C; p = 0.011) were improved in HD-AFSCs-treated area. Numerical values represent percent cells in the gated population, of all cells plotted in the representative experiments.

