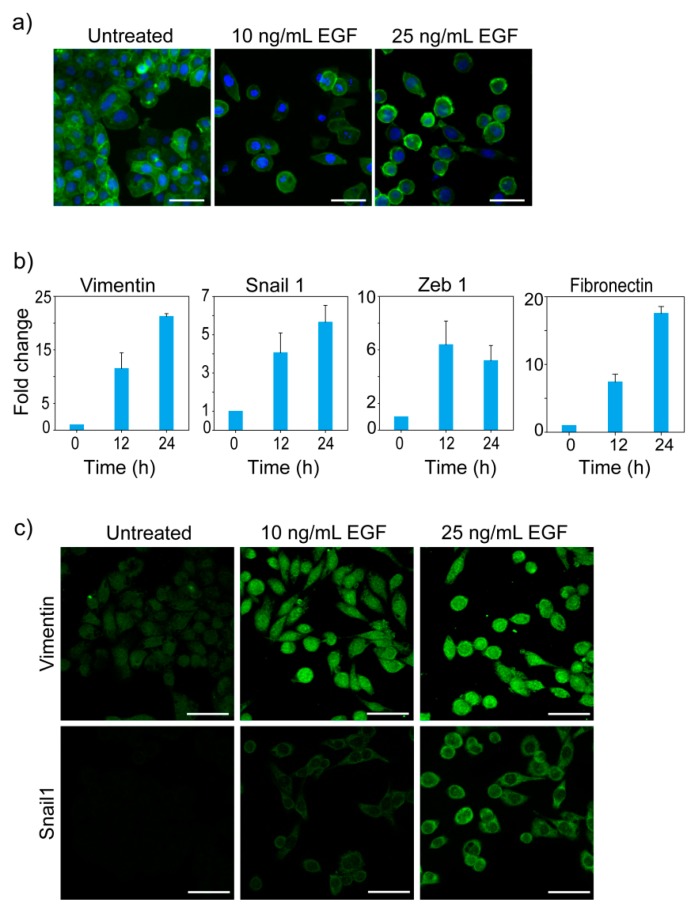
Figure 1.
EGF induces EMT in MDA-MB-468 cells. (a) Cytoskeletal reorganization and change in morphology. After 24 h treatment with different doses of EGF, cells were stained with Phalloidin and DAPI. Green and blue colors represent the cytoskeleton and DNA content respectively. (b) Expression profile of EMT related genes. Cells were treated with 10 ng/mL of EGF and the fold change in expression was measured by qPCR. Averages of three measurements are shown with error bar representing standard deviation. Observed changes in expression of all the genes were statistically significant (Kruskal-Wallis analysis of variance, p < 0.01). (c) Immunofluorescence imaging of Vimentin and Snail1. Cells were treated with different doses of EGF for 24 h and stained with Fluorescent-dye conjugated anti-Vimentin and anti-Snail1 antibodies. Scale bar in images: 50 µm.

