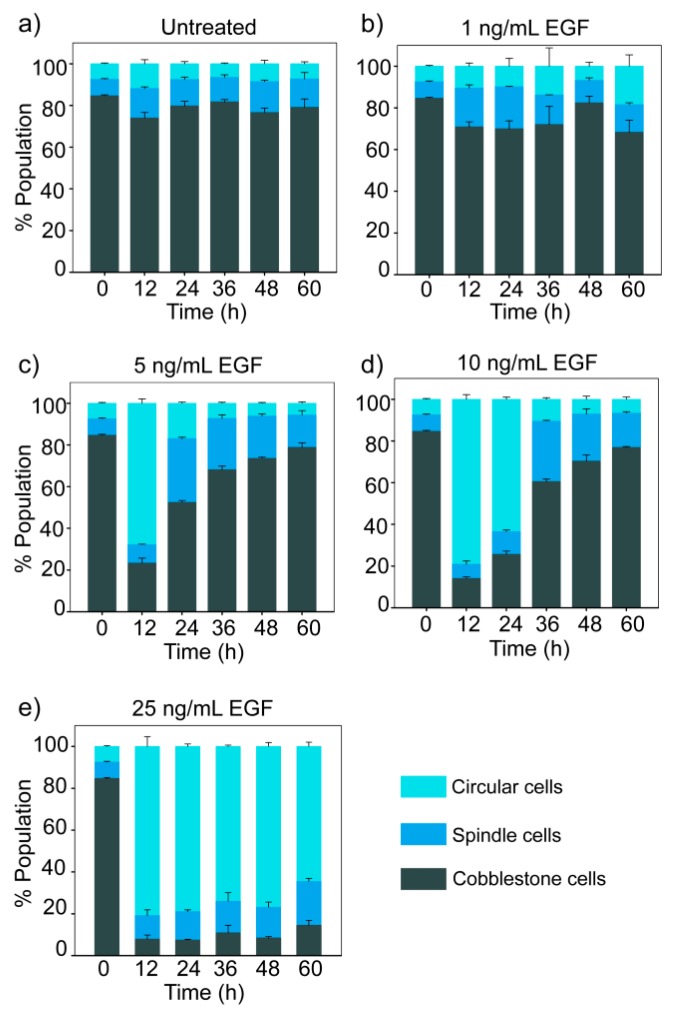
Figure 3.
Dose- and time-dependent effect of EGF on population distribution. MDA-MB-468 cells were treated with different doses of EGF for different durations, and cells were imaged by fluorescence microscopy. The graph represents quantitative data from image analysis. Each data point represents the mean of three independent experiments and error bars indicate standard deviation. (a) In the absence of EGF; (b) 1 ng/mL EGF; (c) 5 ng/mL EGF; (d) 10 ng/mL EGF; (e) 25 ng/mL EGF.

