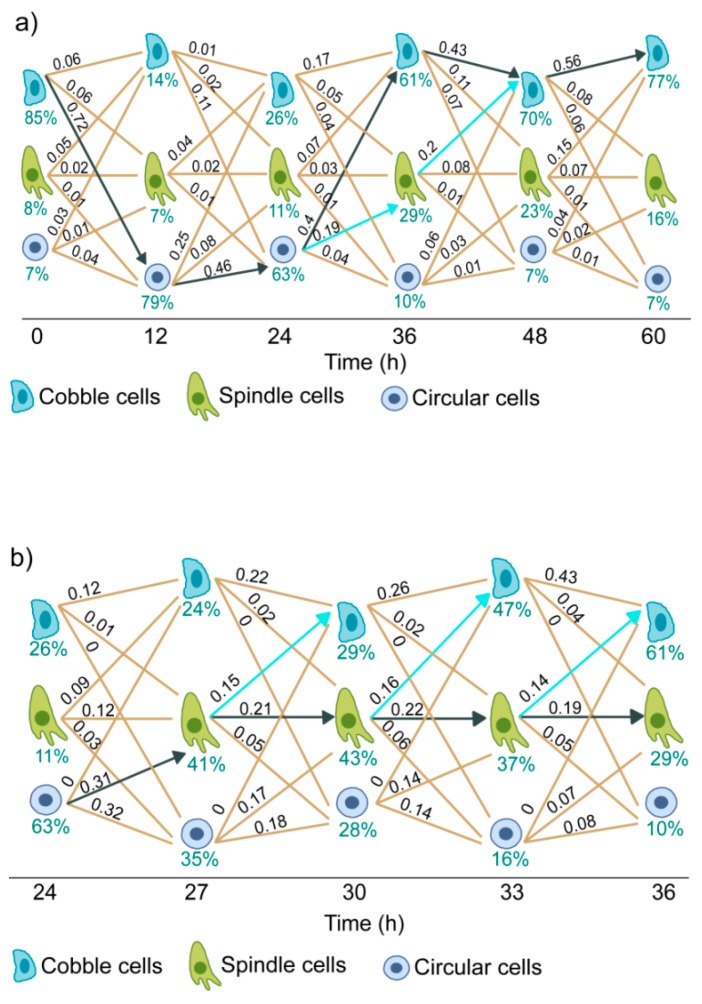
Figure 4.
Cell state transition diagram of MDA-MB-468 cells treated with 10 ng/mL of EGF. Each line represents one state transition path. State transition parameters were estimated from the quantitative imaging data. Numerical values over the lines indicate the normalized flow of cells through those paths. Pointed black arrows show the dominant transition path and pointed blue arrows indicate the next dominant transition path. (a) State transition trajectories for observations at 12 h intervals till 60 h post-EGF treatment and (b) State transition trajectories for observations at 3 h intervals in the period of 24 to 36 h.

