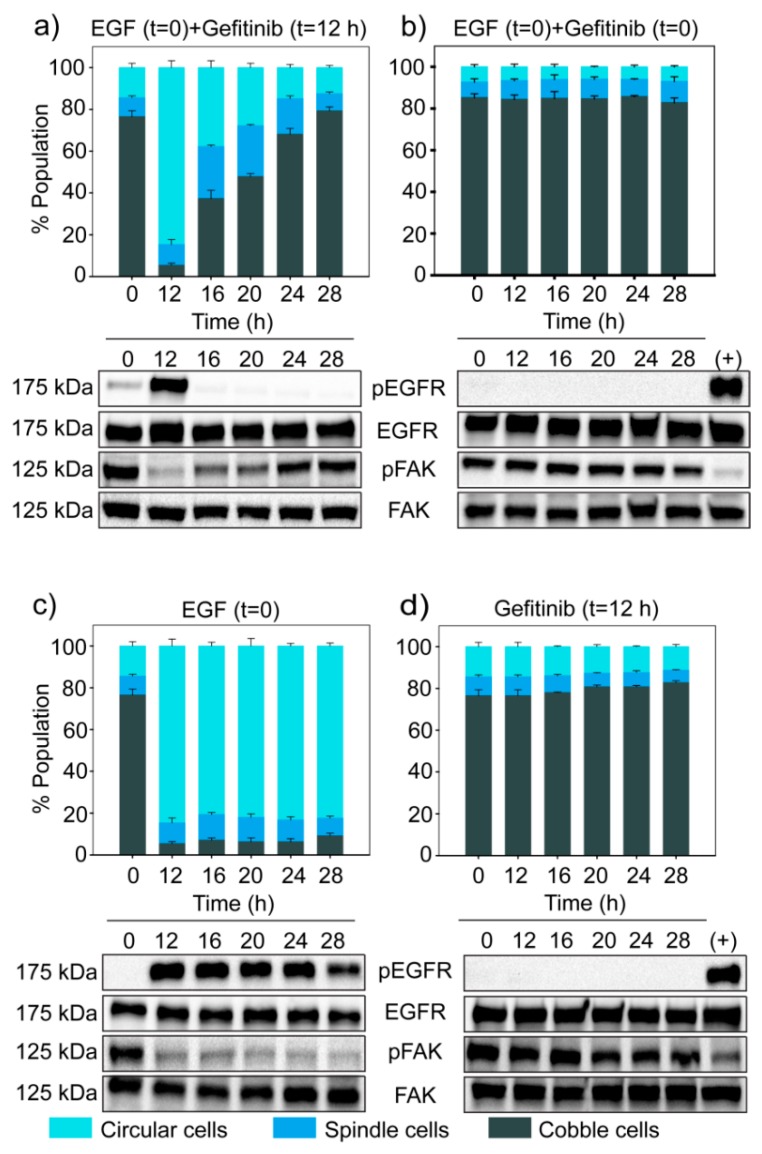
Figure 7.
Blocking EGFR turns the ultrasensitive switch OFF. MDA-MB-468 cells were treated with different experimental conditions—(a) EGF (25 ng/mL) at t = 0 and Gefitinib (0.2 µM) at t = 12 h, (b) EGF (25 ng/mL) and Gefitinib (0.2 µM) together at t = 0, (c) only EGF (25 ng/mL) at t = 0, and (d) only Gefitinib (0.2 µM) at t = 12 h. For all the experimental conditions, EGFR, phospho-EGFR, FAK and phospho-FAK were measured by Western blotting and the corresponding population distribution was estimated through quantitative image analysis. EGF treated samples were used as positive control for phospho-EGFR in (b) and (d). The bar graph represents quantitative data from image analysis. Each data point represents the mean of three independent experiments and error bars indicate standard deviation.

