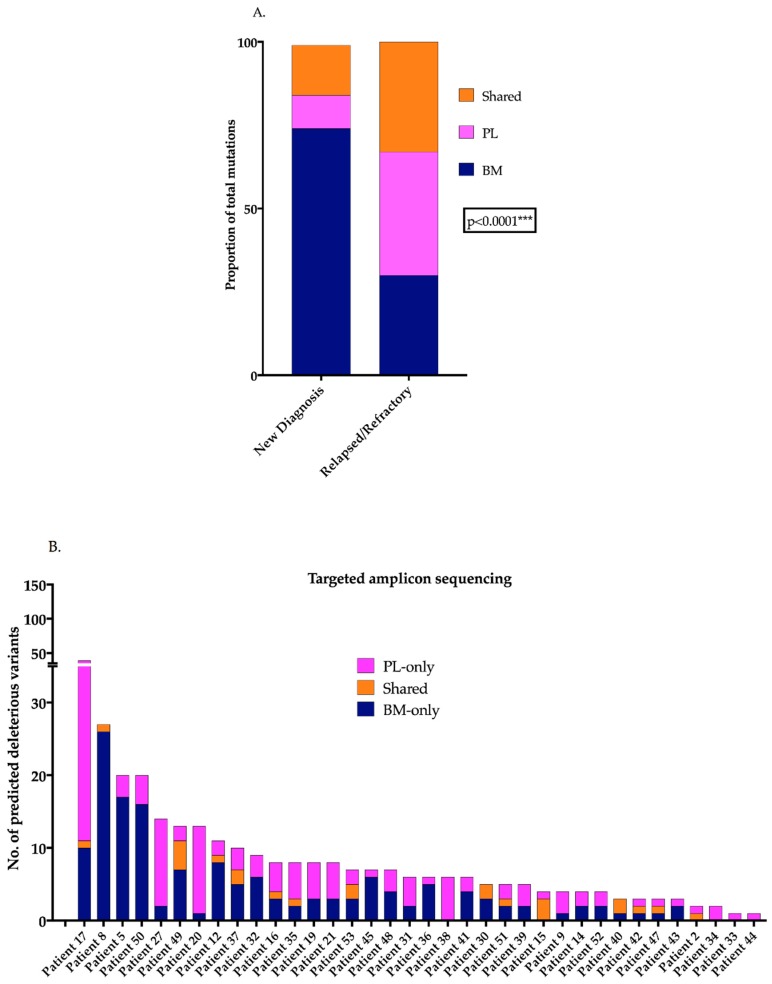
Figure 1.
PL-exclusive mutations are present in MM patients (A) Column graph represents the proportion of mutations within the ND and RR patients (OMD) indicating the significant increase in the proportion of mutations detected in the PL-only in RR patients (Chi-square test, *** p < 0.0001) (B) Column graph represents the number of predicted deleterious and cancer driver variants in matched BM and PL samples obtained from 36 patients through TAS with 92% of patients harbouring variants present exclusively in the PL. PL: plasma, MM: multiple myeloma, ND: new diagnosis, RR: relapsed/refractory, OMD: OnTargetTM mutation detection, TAS: targeted amplicon sequencing.

