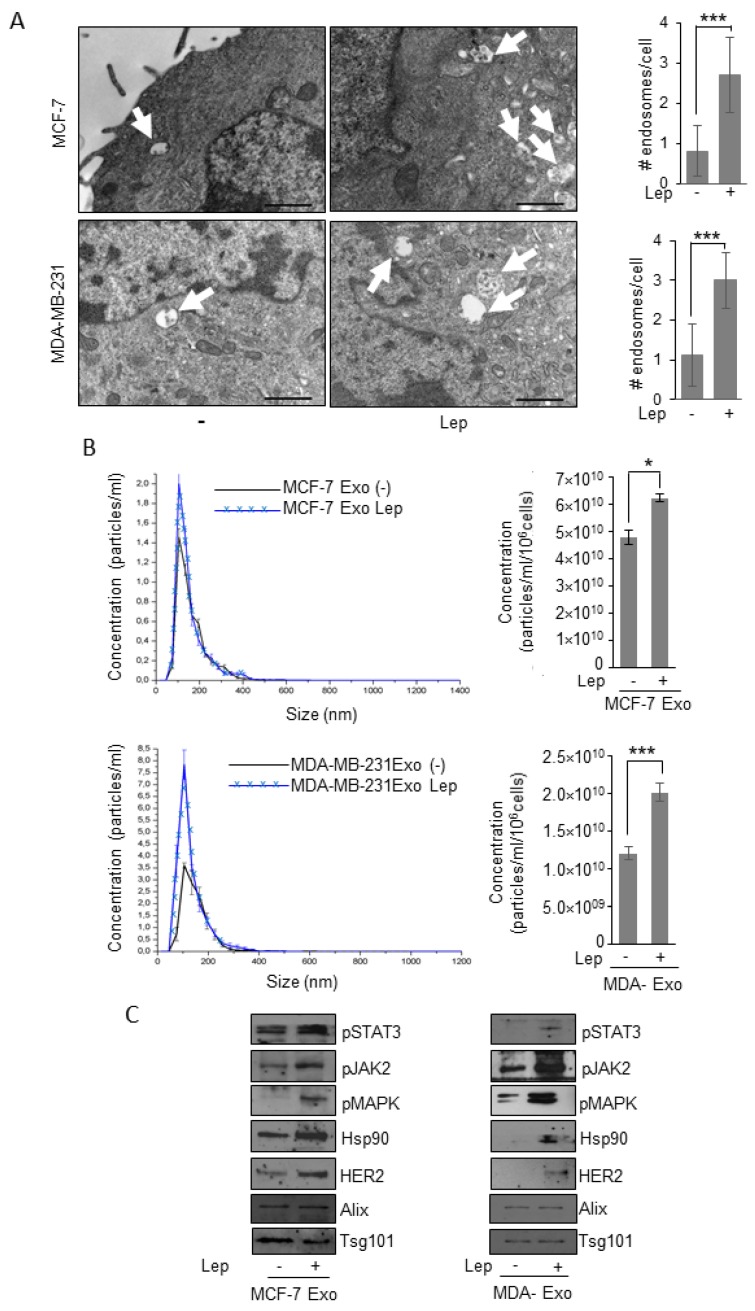
Figure 1.
Leptin effects on exosome release in breast cancer cells. (A) Representative images of transmission electron microscopy (TEM) showing fields of multivesicular bodies (MVBs) in MCF-7 and MDA-MB-231 breast cancer cells treated with vehicle (-) or leptin (Lep, 500 ng/mL) for 48 h. Scale bar 1 μm. The histograms represent the mean ± S.D. of the MVB numbers in more than 15 fields per condition. (B) Representative size distribution profiles of exosomes (Exo), measured by nanoparticle tracking analysis, from conditioned media of MCF-7 and MDA-MB-231 breast cancer cells treated with vehicle (-) or Leptin (Lep, 500 ng/mL) for 48 h. The histograms represent the mean ± S.D. of exosome concentration (particles/mL/106 cells) of three different experiments. (C) Immunoblot analysis of pSTAT3, pJAK2, pMAPK, Hsp90, HER2, Alix, and Tsg101 protein expression in exosomal fraction from MCF-7 and MDA-MB-231 treated with vehicle (-) or with Lep for 48 h. * p < 0.05, *** p < 0.001.

