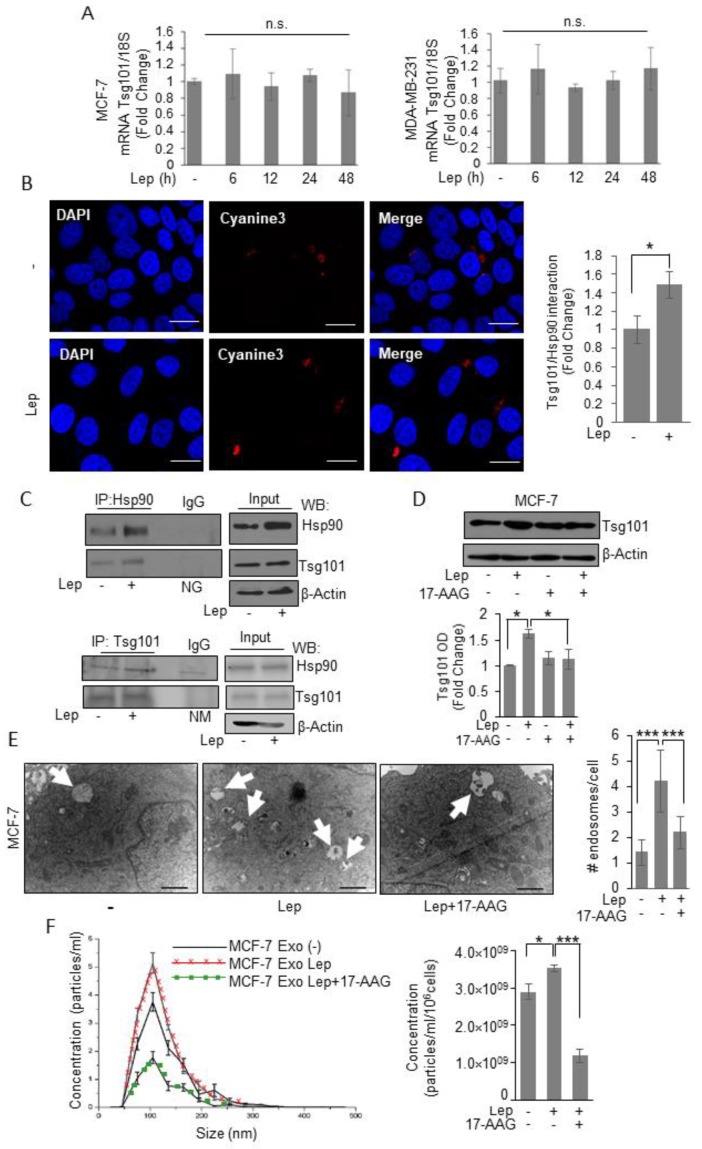
Figure 5.
Leptin induces Tsg101–Hsp90 interaction in breast cancer cells. (A) Total RNA was extracted from MCF-7 and MDA-MB-231 breast cancer cells treated with vehicle (-) or Leptin (Lep, 500 ng/mL) for 6, 12, 24, and 48 h, then reverse transcribed; cDNAs were subjected to real-time RT-PCR using primers specific for TSG101. Each sample was normalized to its 18S rRNA content. The values represent the means ± S.D. of three different experiments each performed in triplicate. (B) Duolink staining (red) was used to detect Tsg101/Hsp90 interaction in MCF-7 breast cancer cells treated with vehicle (-) or Lep for 48 h. DAPI was used for nuclear staining. Red fluorescence was detected by Cyanine3 filter. Images are representative of three different experiments. Scale bar 10 μm. The histograms represent the relative abundance of the Tsg101/Hsp90 complexes (red dots/DAPI) compared to vehicle-treated samples (-) counted by ImageJ software. (C) MCF-7 breast cancer cells were treated with vehicle (-) or Lep for 48 h before lysis. Hsp90 and Tsg101 proteins were immunoprecipitated using anti-Hsp90 (IP:Hsp90) and anti-Tsg101 (IP:Tsg101) antibodies respectively and resolved in SDS–polyacrylamide gel electrophoresis. Immunoblotting was performed using anti-Tsg101 and anti-Hsp90 antibodies respectively. Whole-cell lysates were used as input controls. Negative control was performed by incubation of cell lysates with protein A/G agarose and normal goat (NG) or mouse (NM) antisera. (D) Immunoblot analysis of Tsg101 in whole cell lysate of MCF-7 breast cancer cells treated with vehicle (-) or leptin alone or in combination with the Hsp90 inhibitor, 17-AAG (20nM) for 48 h. The histograms represent the average fold change ± S.D. of three separate experiments in which band intensities were evaluated in terms of optical density arbitrary units (OD), and expressed as fold change versus vehicle-treated samples. (E) Representative images of transmission electron microscopy (TEM) showing Multivescicular bodies (MVBs) in MCF-7 cells treated with vehicle (-) or Leptin (Lep, 500 ng/mL) and/or 17-AAG (20 nM) for 48 h. Scale bar 1 μm. The histograms represent the mean ± S.D. of the MVB numbers in more than 15 fields per condition. (F) Representative size distribution profiles of exosomes (Exo), measured by nanoparticle tracking analysis, from conditioned media of MCF-7 breast cancer cells treated with vehicle (-) or Leptin (Lep, 500 ng/mL) alone or in combination with 17-AAG (20 nM) for 48 h. The histograms represent the mean ± S.D. of exosome concentration (particles/mL/106cells) of two different experiments. * p < 0.05, *** p < 0.001. n.s. nonsignificant.

