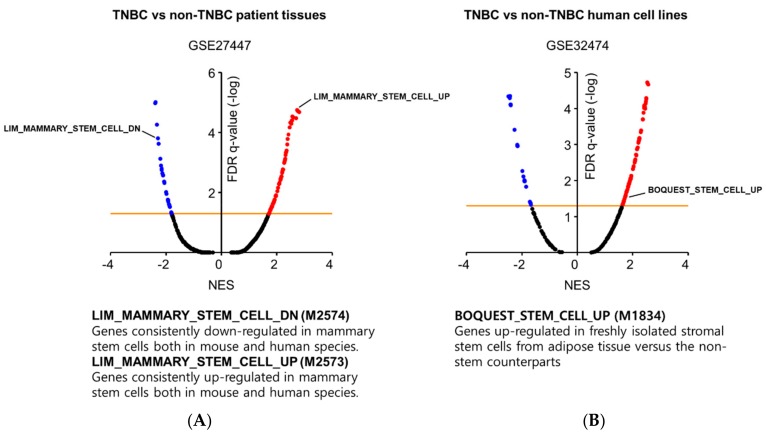
Figure 1.
GSEA results showing significant enrichment of stem cell gene sets in (A) TNBC patient tissues and (B) TNBC human cell lines in relation to non-TNBC counterparts. Gene sets are ordered by the normalized enrichment score (NES); the orange line indicates statistical significance (FDR q-value < 0.05).

