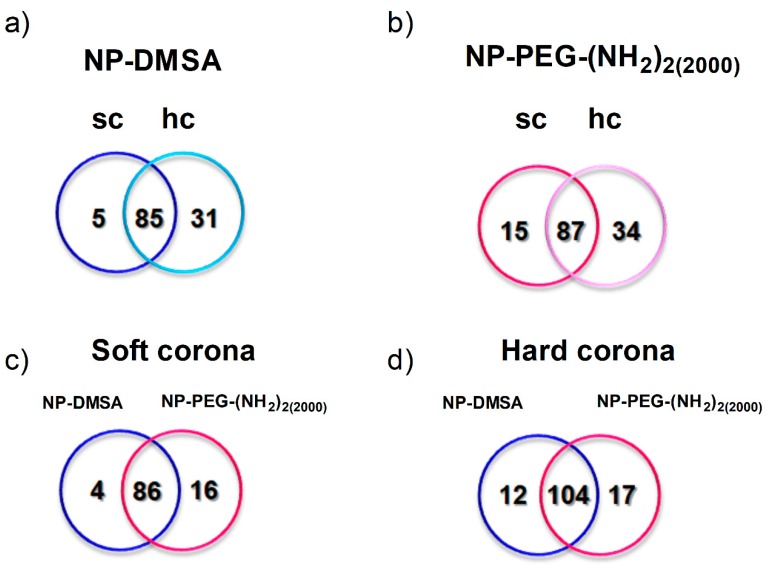
Figure 4.
Proteins identified by mass spectrometry on the surface of the nanoparticles. Individual analysis of the protein corona around: (a) NP-DMSA. (b) NP-PEG-(NH2)2(2000). Sc and hc represent specific proteins detected in the soft and hard corona of the particles, respectively. Overlapped areas represent proteins detected in common in their soft and hard corona. (c) Analysis of the proteins identified in the soft corona of both nanoparticles. (d) Analysis of the proteins identified in the hard corona of the nanoparticles. Blue represents specific proteins detected in NP-DMSA and pink represents specific proteins detected in NP-PEG-(NH2)2(2000). Overlapped areas represent proteins detected in common in those fractions.

