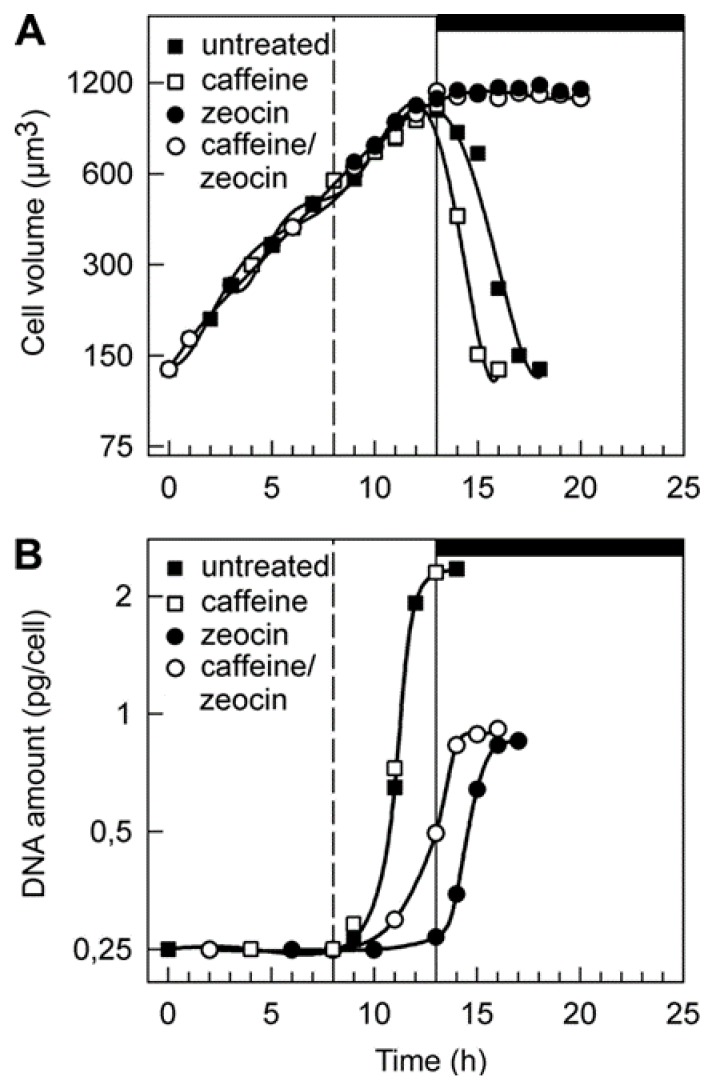
Figure 3.
Cell growth and increase in DNA in synchronized populations of C. reinhardtii cells. The upper graph (A) depicts changes in size of cells grown in the absence of chemicals (full squares), or presence of caffeine (empty squares), zeocin (full circles) and caffeine/zeocin (empty circles). The bottom graph (B) shows the course of DNA replication in the absence of chemicals (full squares), or presence of caffeine (empty squares), zeocin (full circles) and caffeine/zeocin (empty circles). The time of addition of the chemicals is indicated by the dashed line, light and dark periods are marked by stripes above the panel and by the vertical solid line. Means from at least three independent experiments are presented; the standard error did not exceed 5%. Cell growth was not affected by the presence of the drugs, and DNA replication was delayed in the presence of zeocin and caffeine/zeocin.

