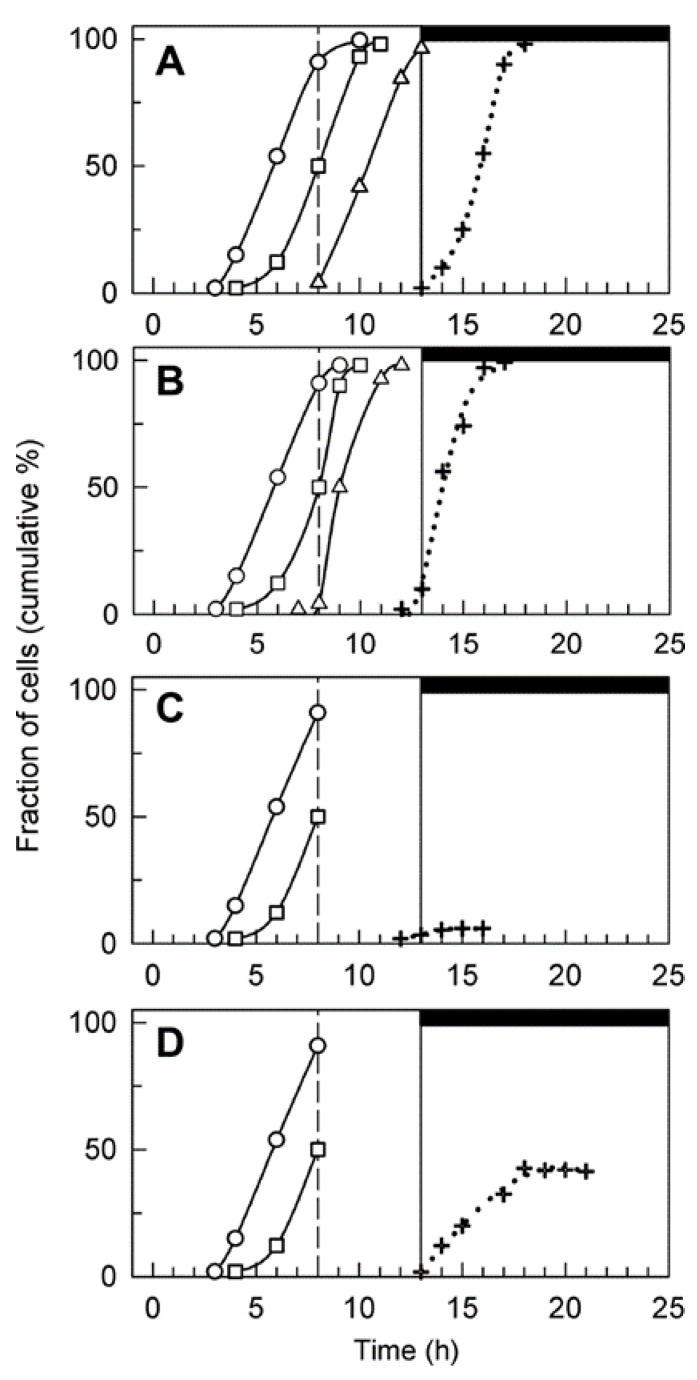
Figure 4.
Cell cycle progression of untreated (A), caffeine-treated (B), zeocin-treated (C) and caffeine/zeocin-treated (D) synchronized populations of C. reinhardtii cells. The graphs show the percentages of cells that attained CP (empty symbols, solid lines) for division into two (circles), four (squares), and eight (triangles) cells, and completed cell division (crosses, dotted line). For caffeine/zeocin treated cultures, the extent of attempted aberrant division is plotted. The addition of caffeine and zeocin at the eighth hour of the cell cycle is marked by the dashed line, light and dark periods are indicated by stripes above the panel and by the vertical solid line. Means from at least four independent experiments are presented; the standard errors did not exceed 5% and are hidden within the symbols. Cell division was accelerated in the presence of caffeine and blocked in the presence of zeocin; about forty percent of the cells attempted an aberrant division in the presence of caffeine/zeocin.

