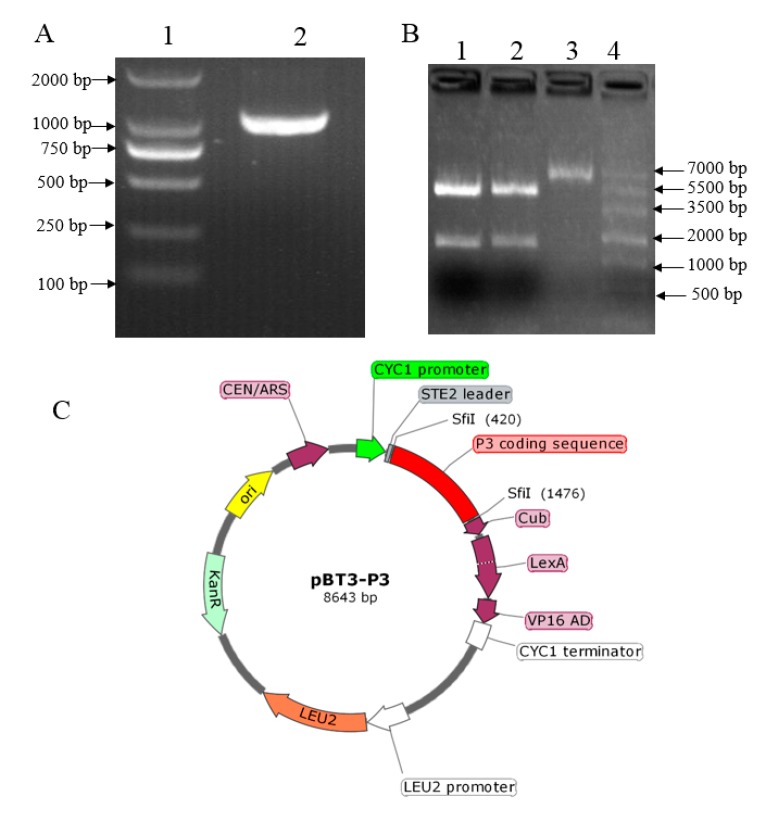
Figure 1.
Construction and verification of the bait vector. (A) Gel electrophoresis image of P3 amplification from cDNA. Lane 1 is a DNA marker in which the strip size was written on the left, and lane 2 is the PCR product of P3 from cDNA. (B) Gel electrophoresis image of the digested recombinant plasmid. lane 1 and 2: pBT3-P3 digested by Sfi I; lane 3: pBT3 plasmid; lane 4: marker in which the strip size was indicated on the right. (C) The image of the plasmid pBT3-P3 construction.

