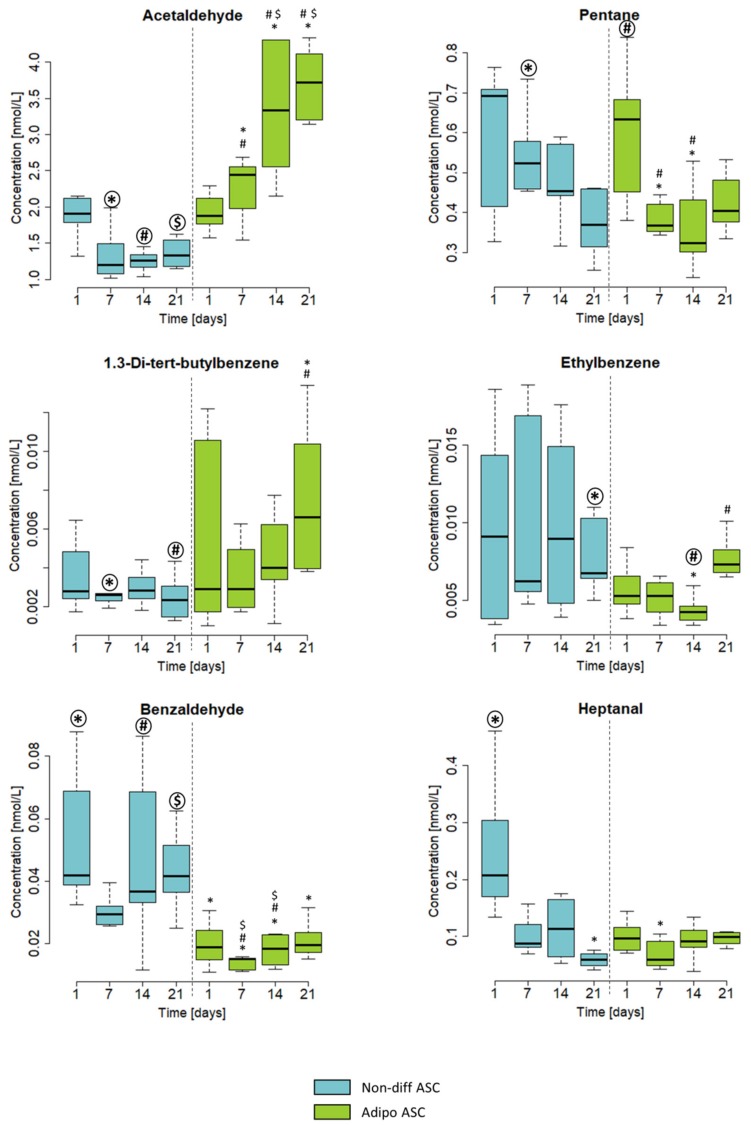
Figure 3.
Emissions of acetaldehyde, pentane, 1,3-di-tert-butylbenzene, ethylbenzene, benzaldehyde, and heptanal from nondifferentiating (non-diff ASC, blue) and adipogenically differentiating ASC (adipo ASC, green). Concentrations in the headspace are shown in nmol/L on the Y-axis. The X-axis shows the time points of measurements. The boxplots represent data from three independent experiments. Significance was tested within all groups. Symbols (*, #, $) indicate significant differences to the corresponding highlighted group (p-values < 0.05).

