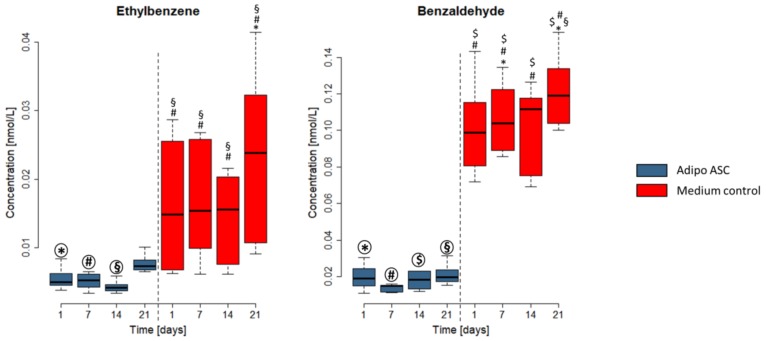
Figure 4.
Example of two VOCs showing lower emissions in adipogenic differentiating ASC (adipo ASC) cultures than in the culture media controls. Concentrations in the headspace in nmol/L are shown on the Y-axis. The X-axis shows the time point of measurements. The diagram shows cell culture with adipogenically differentiating ASC (referred to as Adipo ASC, in blue) and medium controls (samples without cells, in red). Boxplots represent the data from three independent differentiation experiments. Significance was tested within all groups. Symbols (*, #, §, $) indicate significant differences to the corresponding highlighted group (p-values < 0.05).

