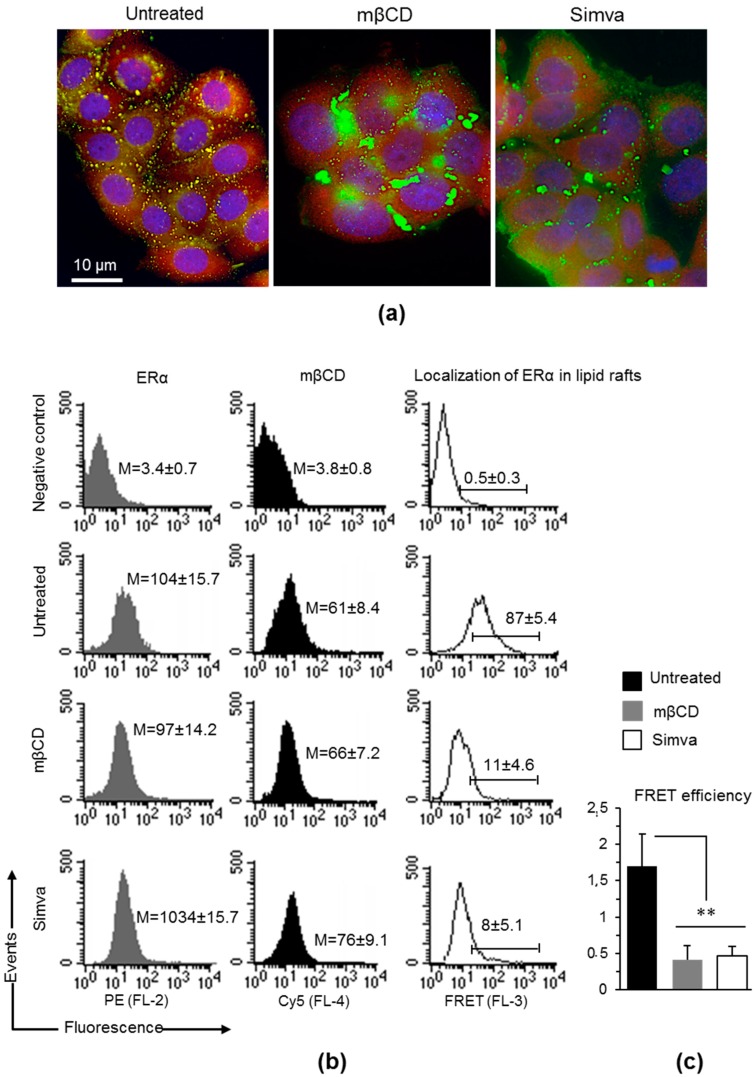
Figure 3.
Localization of mERα within lipid rafts. (a) intensified video microscopy (IVM) analysis after triple cell staining with fluorescein isothiocyanate (FITC)-conjugated CTxB (green)/ERα (red)/Hoechst (blue) in MCF-7 cells untreated or treated with mβCD or simvastatin. Yellow fluorescence indicates localization of ERα within lipid rafts. Magnification, 700×. (b) Quantitative evaluations by fluorescence resonance energy transfer (FRET) technique of the localization of mERα within lipid rafts (labeled by CTxB), as revealed by flow cytometry analysis. Numbers in the first and second columns (grey and black histograms) indicate the median fluorescence intensity. In the third column (empty histograms) the percentage of FL3-positive events, obtained in one experiment representative of three, is shown. (c) Bar graph showing the FRET efficiency, calculated according to the Riemann’s algorithm. Data are reported as mean ± SD from three independent experiments. **, p < 0.01 vs. untreated cell samples by Student’s t test. Simva: simvastatin.

