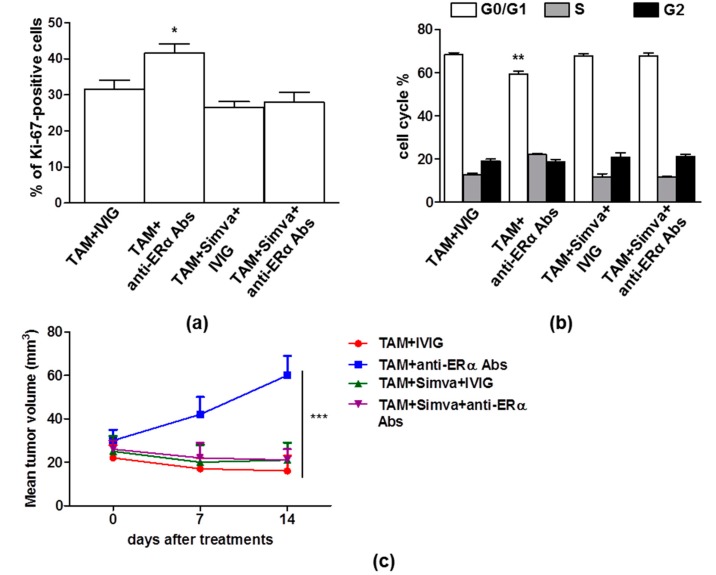
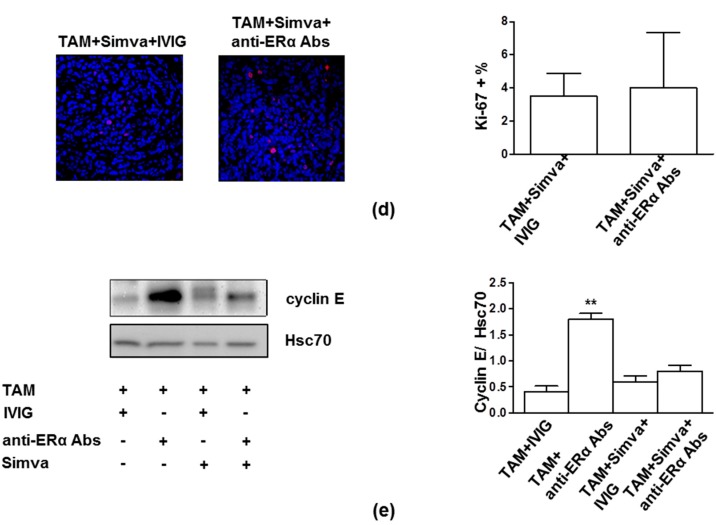
Figure 4.
Simvastatin treatment, blocking anti-ERα Abs action, restored TAM effect both in vitro and in vivo. (a) Cell proliferation was evaluated by flow cytometry measuring Ki-67 nuclear antigen expression in MCF-7 cells treated for 24 h with TAM (1 μM) in combination with (i) IVIG (50 μg/mL); (ii) anti-ERα Abs (50 μg/mL); (iii) IVIG (50 μg/mL) plus simvastatin (2.5 μM); (iv) anti-ERα Abs (50 μg/mL) plus simvastatin (2.5 μM). Data are reported as mean ± SD of five independent experiments. TAM plus anti-ERα Abs vs. each other condition, *, p < 0.05 by Student’s t test. (b) Cell-cycle phases were determined by flow cytometry analysis of BrdU/7AAD staining in synchronized MCF-7 cells treated as reported in panel a. Data are reported as mean ± SD of each phase of five independent experiments. TAM plus anti-ERα Abs vs. each other condition for G0/G1 phase **, p < 0.01 by Student’s t test. (c) The mean (± SD) of the tumor volume of one set of experiment (five mice/group) was shown. The tumor volumes were calculated using the following formula: (a × b2)/2, where a and b represent the longest and shortest diameters, respectively. At day 14, TAM plus anti-ERα Abs vs. each other condition, ***, p < 0.001 by Student’s t test. (d) Representative sections from MCF-7 tumors treated with TAM + IVIG + Simva and TAM + anti-ERα Abs + Simva, immunostained with anti-Ki67 (red) antibodies and counterstained with Hoechst (blue) are shown. Ki-67 was scored by the average method as reported in Methods. Results are also represented as mean ± SD. Scale bar = 50 μm. (e) Western blot analysis of cyclin E in tumor lysates. For each cell line, blots shown are representative of five independent experiments (left). Densitometry analysis of specific protein levels relative to Hsc70 is also shown (right). Values are expressed as mean ± SD; TAM plus anti-ERα Abs vs. each other condition, **, p < 0.01 by Student’s t test. Simva: simvastatin.


