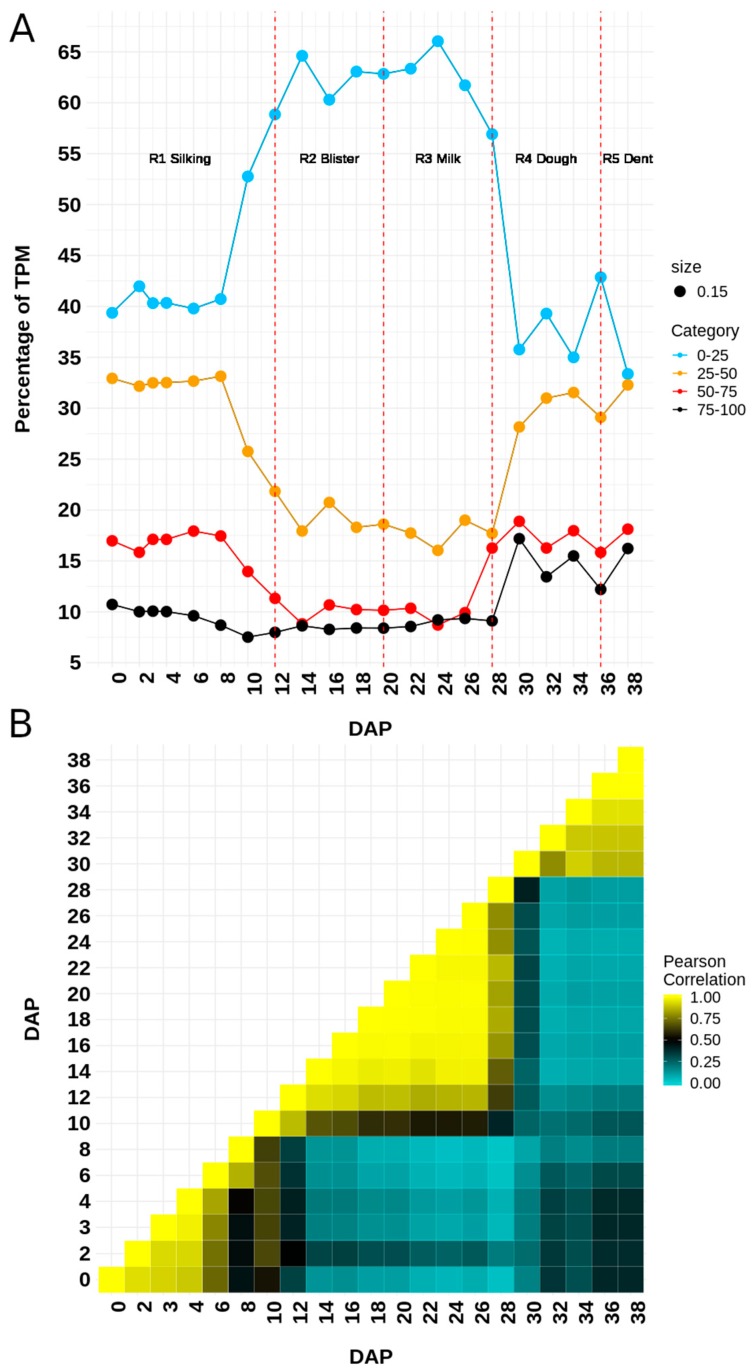
Figure 4.
Expression patterns of transcripts according to the disorder content of the protein that they encode. (A) Percentage of TPM of transcripts encoding for proteins with different degrees of protein disorder. There is an induction in the overall expression of transcripts encoding for structured proteins during the middle phase of seed development. (B) Pearson’s correlation analysis of the expression of transcripts encoding for proteins with > 25% of disorder. There is a clear separation of the different phases of development, which suggests a marked specific expression of transcripts during each of the developmental stages.

