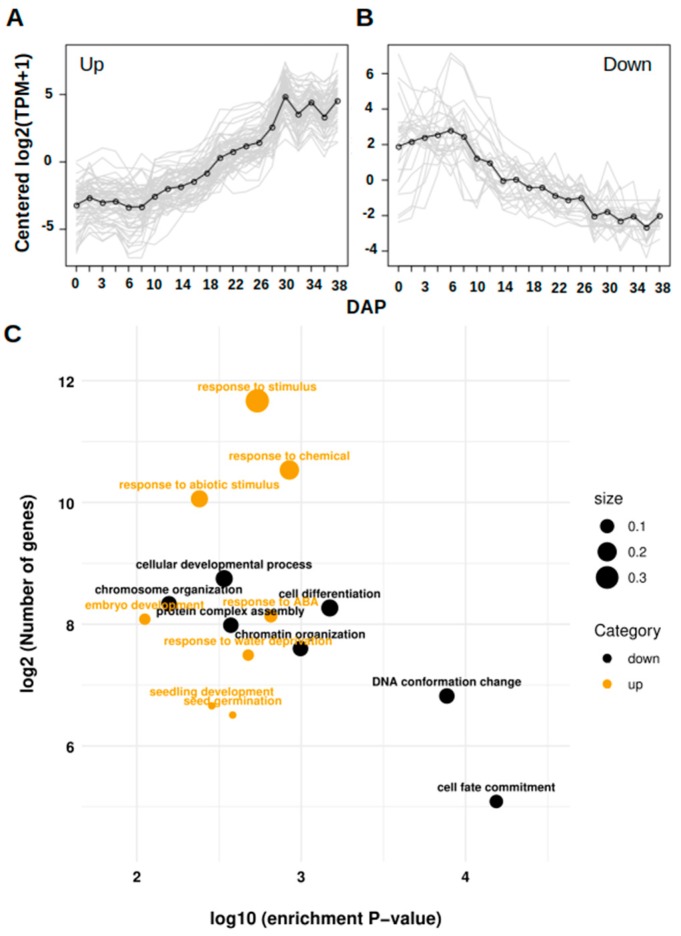
Figure 6.
Gene expression profile of highly disordered IDPs with more than 75% of disorder in its sequence. (A) and (B) There is a group of IDPs which are induced and another group which are actively repressed throughout the period evaluated. (C) Functional enrichment analysis for each up and down-regulated gene encoding for highly IDPs. The size is proportional to the number of enriched genes among the total number of their GO term associated genes.

